Brazilian vs Immigrants from Central America Master's Degree
COMPARE
Brazilian
Immigrants from Central America
Master's Degree
Master's Degree Comparison
Brazilians
Immigrants from Central America
16.5%
MASTER'S DEGREE
96.8/ 100
METRIC RATING
118th/ 347
METRIC RANK
10.0%
MASTER'S DEGREE
0.0/ 100
METRIC RATING
335th/ 347
METRIC RANK
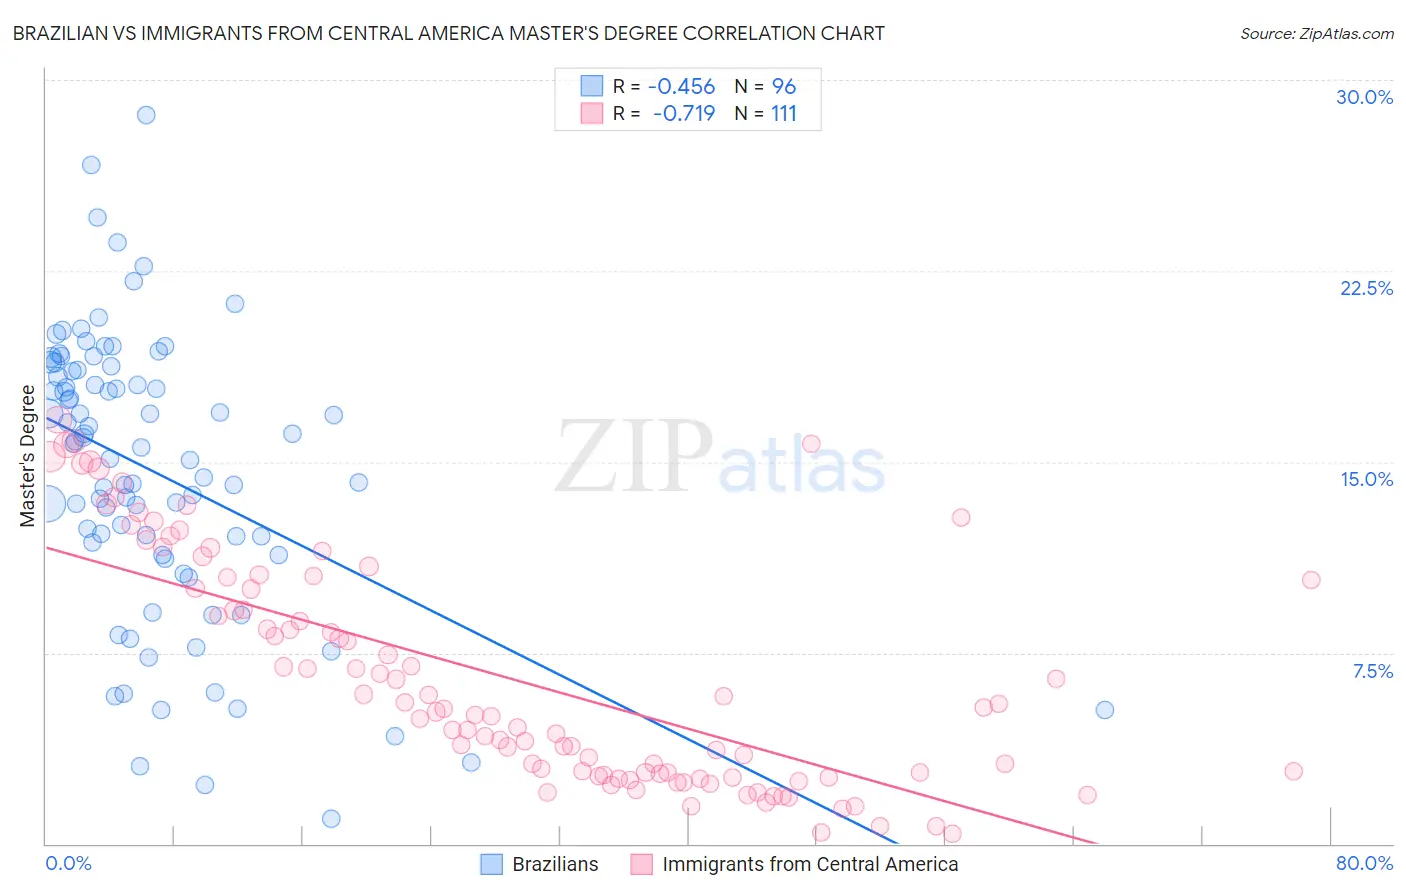
Brazilian vs Immigrants from Central America Master's Degree Correlation Chart
The statistical analysis conducted on geographies consisting of 323,872,628 people shows a moderate negative correlation between the proportion of Brazilians and percentage of population with at least master's degree education in the United States with a correlation coefficient (R) of -0.456 and weighted average of 16.5%. Similarly, the statistical analysis conducted on geographies consisting of 535,778,431 people shows a strong negative correlation between the proportion of Immigrants from Central America and percentage of population with at least master's degree education in the United States with a correlation coefficient (R) of -0.719 and weighted average of 10.0%, a difference of 65.8%.
Master's Degree Correlation Summary
| Measurement | Brazilian | Immigrants from Central America |
| Minimum | 0.97% | 0.37% |
| Maximum | 28.6% | 16.7% |
| Range | 27.6% | 16.3% |
| Mean | 14.6% | 6.5% |
| Median | 15.7% | 5.2% |
| Interquartile 25% (IQ1) | 11.6% | 2.7% |
| Interquartile 75% (IQ3) | 18.6% | 10.3% |
| Interquartile Range (IQR) | 7.0% | 7.6% |
| Standard Deviation (Sample) | 5.5% | 4.5% |
| Standard Deviation (Population) | 5.5% | 4.4% |
Similar Demographics by Master's Degree
Demographics Similar to Brazilians by Master's Degree
In terms of master's degree, the demographic groups most similar to Brazilians are Jordanian (16.5%, a difference of 0.23%), Lebanese (16.5%, a difference of 0.33%), Immigrants from Moldova (16.6%, a difference of 0.42%), Immigrants from Southern Europe (16.6%, a difference of 0.43%), and Afghan (16.5%, a difference of 0.53%).
| Demographics | Rating | Rank | Master's Degree |
| Austrians | 97.8 /100 | #111 | Exceptional 16.7% |
| Macedonians | 97.7 /100 | #112 | Exceptional 16.7% |
| Arabs | 97.7 /100 | #113 | Exceptional 16.7% |
| Northern Europeans | 97.6 /100 | #114 | Exceptional 16.7% |
| Immigrants | Uganda | 97.3 /100 | #115 | Exceptional 16.6% |
| Immigrants | Southern Europe | 97.2 /100 | #116 | Exceptional 16.6% |
| Immigrants | Moldova | 97.2 /100 | #117 | Exceptional 16.6% |
| Brazilians | 96.8 /100 | #118 | Exceptional 16.5% |
| Jordanians | 96.5 /100 | #119 | Exceptional 16.5% |
| Lebanese | 96.4 /100 | #120 | Exceptional 16.5% |
| Afghans | 96.2 /100 | #121 | Exceptional 16.5% |
| British | 95.6 /100 | #122 | Exceptional 16.4% |
| Croatians | 95.6 /100 | #123 | Exceptional 16.4% |
| Immigrants | Eritrea | 95.5 /100 | #124 | Exceptional 16.4% |
| Italians | 95.4 /100 | #125 | Exceptional 16.4% |
Demographics Similar to Immigrants from Central America by Master's Degree
In terms of master's degree, the demographic groups most similar to Immigrants from Central America are Arapaho (10.0%, a difference of 0.13%), Native/Alaskan (9.9%, a difference of 0.50%), Menominee (10.2%, a difference of 2.1%), Immigrants from the Azores (10.2%, a difference of 2.5%), and Mexican (9.7%, a difference of 2.8%).
| Demographics | Rating | Rank | Master's Degree |
| Bangladeshis | 0.0 /100 | #328 | Tragic 10.5% |
| Nepalese | 0.0 /100 | #329 | Tragic 10.5% |
| Fijians | 0.0 /100 | #330 | Tragic 10.3% |
| Pueblo | 0.0 /100 | #331 | Tragic 10.3% |
| Immigrants | Azores | 0.0 /100 | #332 | Tragic 10.2% |
| Menominee | 0.0 /100 | #333 | Tragic 10.2% |
| Arapaho | 0.0 /100 | #334 | Tragic 10.0% |
| Immigrants | Central America | 0.0 /100 | #335 | Tragic 10.0% |
| Natives/Alaskans | 0.0 /100 | #336 | Tragic 9.9% |
| Mexicans | 0.0 /100 | #337 | Tragic 9.7% |
| Tohono O'odham | 0.0 /100 | #338 | Tragic 9.7% |
| Spanish American Indians | 0.0 /100 | #339 | Tragic 9.6% |
| Yakama | 0.0 /100 | #340 | Tragic 9.5% |
| Navajo | 0.0 /100 | #341 | Tragic 9.4% |
| Immigrants | Mexico | 0.0 /100 | #342 | Tragic 9.3% |