Crow vs White/Caucasian 8th Grade
COMPARE
Crow
White/Caucasian
8th Grade
8th Grade Comparison
Crow
Whites/Caucasians
99.0%
8TH GRADE
100.0/ 100
METRIC RATING
1st/ 347
METRIC RANK
96.7%
8TH GRADE
99.8/ 100
METRIC RATING
62nd/ 347
METRIC RANK
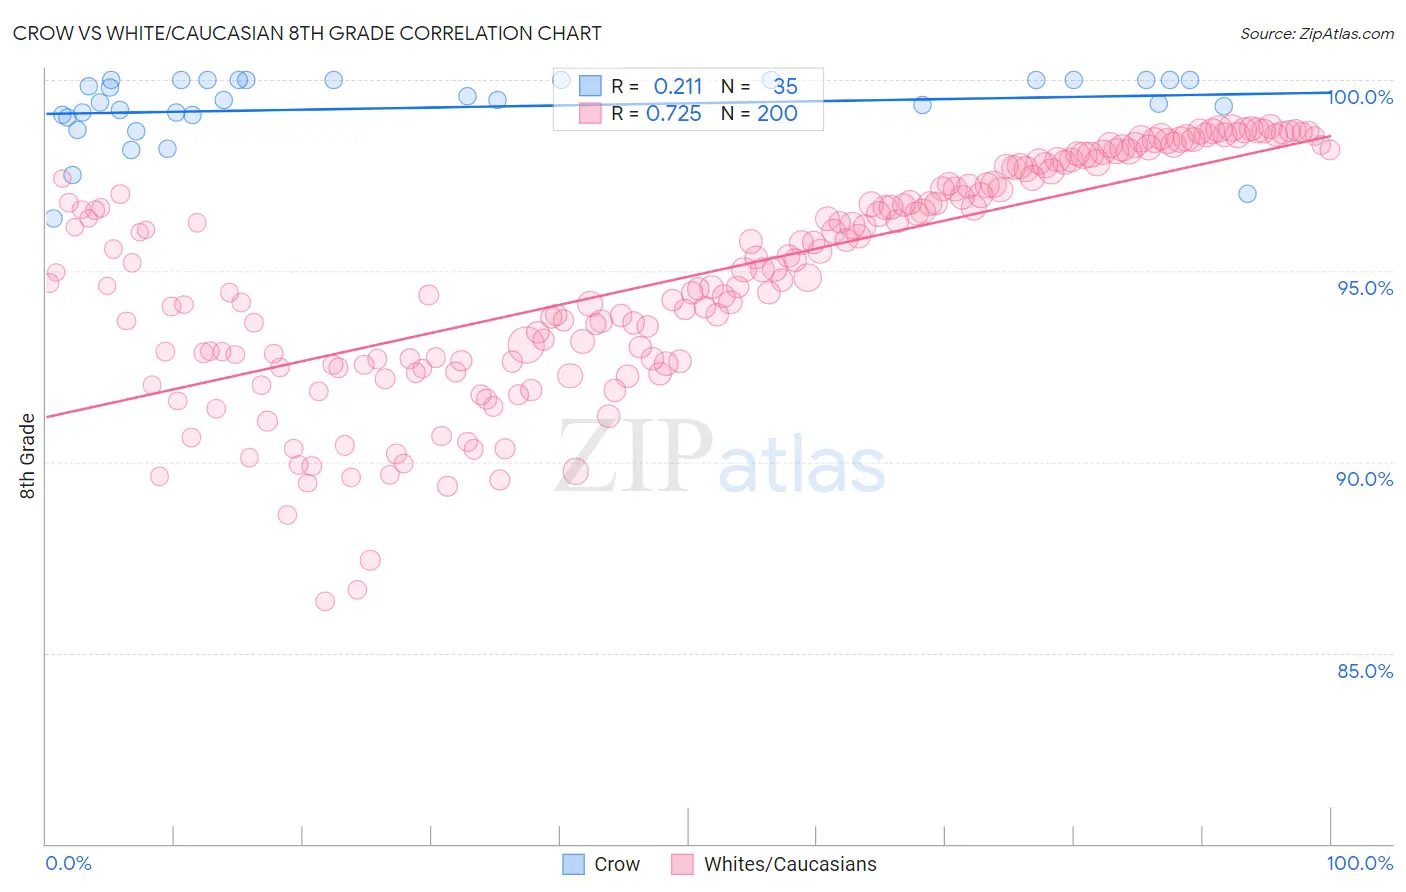
Crow vs White/Caucasian 8th Grade Correlation Chart
The statistical analysis conducted on geographies consisting of 665,246 people shows a weak positive correlation between the proportion of Crow and percentage of population with at least 8th grade education in the United States with a correlation coefficient (R) of 0.211 and weighted average of 99.0%. Similarly, the statistical analysis conducted on geographies consisting of 585,246,768 people shows a strong positive correlation between the proportion of Whites/Caucasians and percentage of population with at least 8th grade education in the United States with a correlation coefficient (R) of 0.725 and weighted average of 96.7%, a difference of 2.5%.
8th Grade Correlation Summary
| Measurement | Crow | White/Caucasian |
| Minimum | 96.4% | 86.3% |
| Maximum | 100.0% | 98.8% |
| Range | 3.6% | 12.4% |
| Mean | 99.3% | 94.9% |
| Median | 99.5% | 95.0% |
| Interquartile 25% (IQ1) | 99.1% | 92.6% |
| Interquartile 75% (IQ3) | 100.0% | 97.5% |
| Interquartile Range (IQR) | 0.92% | 4.9% |
| Standard Deviation (Sample) | 0.90% | 2.9% |
| Standard Deviation (Population) | 0.89% | 2.9% |
Similar Demographics by 8th Grade
Demographics Similar to Crow by 8th Grade
In terms of 8th grade, the demographic groups most similar to Crow are Tsimshian (99.0%, a difference of 0.090%), Finnish (98.4%, a difference of 0.69%), Carpatho Rusyn (98.1%, a difference of 0.92%), Ottawa (97.9%, a difference of 1.1%), and Dutch (97.7%, a difference of 1.4%).
| Demographics | Rating | Rank | 8th Grade |
| Crow | 100.0 /100 | #1 | Exceptional 99.0% |
| Tsimshian | 100.0 /100 | #2 | Exceptional 99.0% |
| Finns | 100.0 /100 | #3 | Exceptional 98.4% |
| Carpatho Rusyns | 100.0 /100 | #4 | Exceptional 98.1% |
| Ottawa | 100.0 /100 | #5 | Exceptional 97.9% |
| Dutch | 100.0 /100 | #6 | Exceptional 97.7% |
| Norwegians | 100.0 /100 | #7 | Exceptional 97.6% |
| Slovaks | 100.0 /100 | #8 | Exceptional 97.6% |
| Germans | 100.0 /100 | #9 | Exceptional 97.5% |
| Slovenes | 100.0 /100 | #10 | Exceptional 97.5% |
| Poles | 100.0 /100 | #11 | Exceptional 97.4% |
| Swedes | 100.0 /100 | #12 | Exceptional 97.4% |
| Alaskan Athabascans | 100.0 /100 | #13 | Exceptional 97.3% |
| English | 100.0 /100 | #14 | Exceptional 97.3% |
| Pennsylvania Germans | 100.0 /100 | #15 | Exceptional 97.3% |
Demographics Similar to Whites/Caucasians by 8th Grade
In terms of 8th grade, the demographic groups most similar to Whites/Caucasians are Immigrants from Austria (96.7%, a difference of 0.010%), Immigrants from North America (96.7%, a difference of 0.020%), Immigrants from Northern Europe (96.7%, a difference of 0.020%), Ukrainian (96.7%, a difference of 0.020%), and Immigrants from India (96.6%, a difference of 0.020%).
| Demographics | Rating | Rank | 8th Grade |
| Russians | 99.8 /100 | #55 | Exceptional 96.7% |
| Australians | 99.8 /100 | #56 | Exceptional 96.7% |
| Macedonians | 99.8 /100 | #57 | Exceptional 96.7% |
| Immigrants | Canada | 99.8 /100 | #58 | Exceptional 96.7% |
| Immigrants | North America | 99.8 /100 | #59 | Exceptional 96.7% |
| Immigrants | Northern Europe | 99.8 /100 | #60 | Exceptional 96.7% |
| Immigrants | Austria | 99.8 /100 | #61 | Exceptional 96.7% |
| Whites/Caucasians | 99.8 /100 | #62 | Exceptional 96.7% |
| Ukrainians | 99.7 /100 | #63 | Exceptional 96.7% |
| Immigrants | India | 99.7 /100 | #64 | Exceptional 96.6% |
| Native Hawaiians | 99.7 /100 | #65 | Exceptional 96.6% |
| Canadians | 99.7 /100 | #66 | Exceptional 96.6% |
| Iranians | 99.7 /100 | #67 | Exceptional 96.6% |
| Creek | 99.7 /100 | #68 | Exceptional 96.6% |
| Americans | 99.7 /100 | #69 | Exceptional 96.6% |