Yakama vs Native/Alaskan 8th Grade
COMPARE
Yakama
Native/Alaskan
8th Grade
8th Grade Comparison
Yakama
Natives/Alaskans
91.2%
8TH GRADE
0.0/ 100
METRIC RATING
340th/ 347
METRIC RANK
95.2%
8TH GRADE
2.3/ 100
METRIC RATING
238th/ 347
METRIC RANK
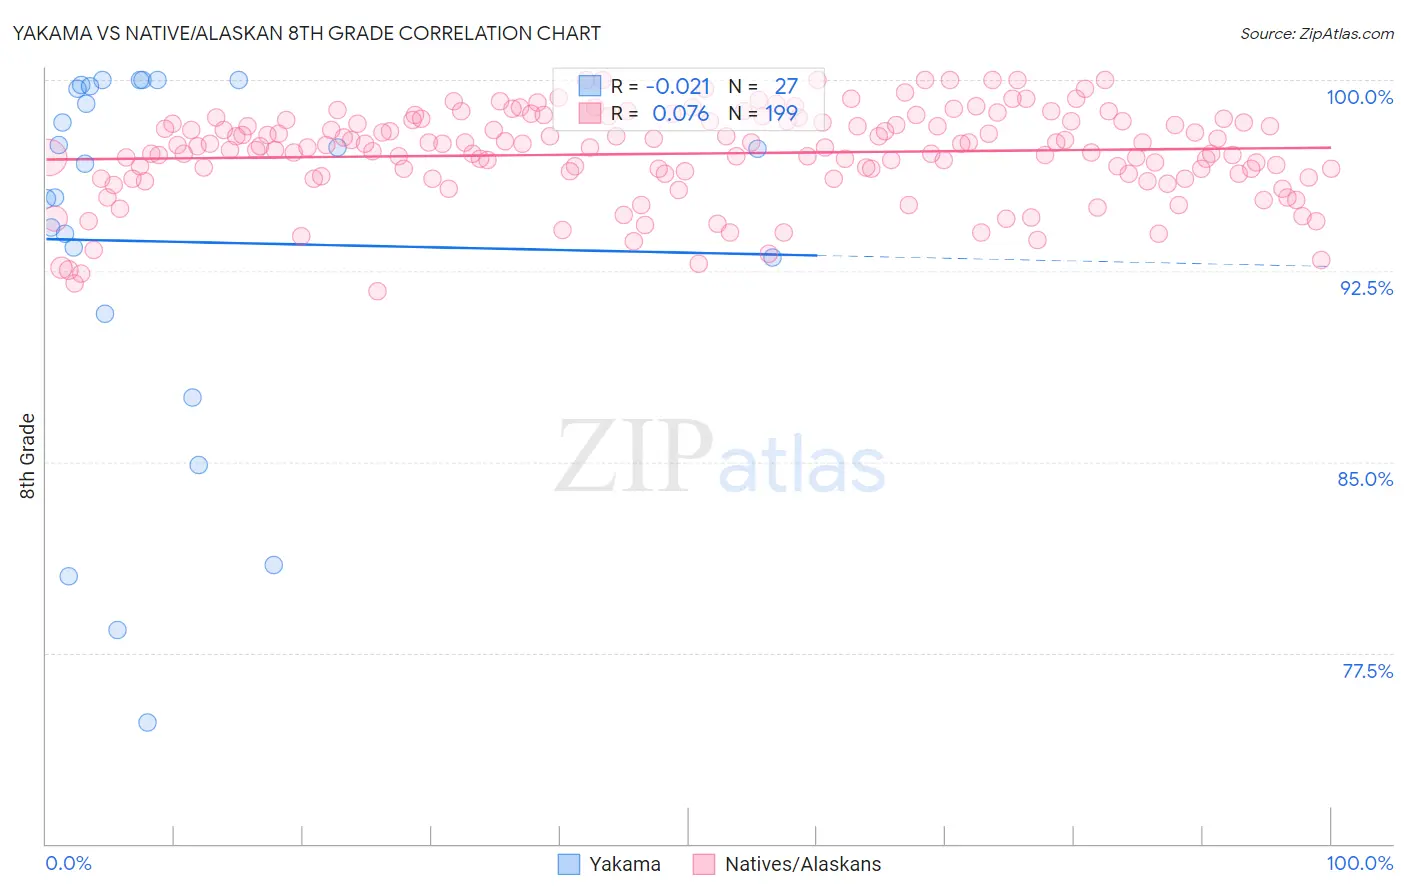
Yakama vs Native/Alaskan 8th Grade Correlation Chart
The statistical analysis conducted on geographies consisting of 19,923,144 people shows no correlation between the proportion of Yakama and percentage of population with at least 8th grade education in the United States with a correlation coefficient (R) of -0.021 and weighted average of 91.2%. Similarly, the statistical analysis conducted on geographies consisting of 513,072,559 people shows a slight positive correlation between the proportion of Natives/Alaskans and percentage of population with at least 8th grade education in the United States with a correlation coefficient (R) of 0.076 and weighted average of 95.2%, a difference of 4.3%.
8th Grade Correlation Summary
| Measurement | Yakama | Native/Alaskan |
| Minimum | 74.8% | 91.7% |
| Maximum | 100.0% | 100.0% |
| Range | 25.2% | 8.3% |
| Mean | 93.7% | 97.1% |
| Median | 96.7% | 97.4% |
| Interquartile 25% (IQ1) | 90.8% | 96.2% |
| Interquartile 75% (IQ3) | 99.8% | 98.4% |
| Interquartile Range (IQR) | 9.0% | 2.2% |
| Standard Deviation (Sample) | 7.5% | 1.8% |
| Standard Deviation (Population) | 7.4% | 1.8% |
Similar Demographics by 8th Grade
Demographics Similar to Yakama by 8th Grade
In terms of 8th grade, the demographic groups most similar to Yakama are Guatemalan (91.1%, a difference of 0.11%), Mexican (91.4%, a difference of 0.13%), Central American (91.6%, a difference of 0.36%), Salvadoran (90.9%, a difference of 0.40%), and Immigrants from Latin America (91.7%, a difference of 0.50%).
| Demographics | Rating | Rank | 8th Grade |
| Hispanics or Latinos | 0.0 /100 | #333 | Tragic 92.2% |
| Immigrants | Yemen | 0.0 /100 | #334 | Tragic 92.1% |
| Mexican American Indians | 0.0 /100 | #335 | Tragic 92.1% |
| Immigrants | Honduras | 0.0 /100 | #336 | Tragic 91.9% |
| Immigrants | Latin America | 0.0 /100 | #337 | Tragic 91.7% |
| Central Americans | 0.0 /100 | #338 | Tragic 91.6% |
| Mexicans | 0.0 /100 | #339 | Tragic 91.4% |
| Yakama | 0.0 /100 | #340 | Tragic 91.2% |
| Guatemalans | 0.0 /100 | #341 | Tragic 91.1% |
| Salvadorans | 0.0 /100 | #342 | Tragic 90.9% |
| Immigrants | Guatemala | 0.0 /100 | #343 | Tragic 90.7% |
| Immigrants | Central America | 0.0 /100 | #344 | Tragic 90.4% |
| Immigrants | El Salvador | 0.0 /100 | #345 | Tragic 90.3% |
| Immigrants | Mexico | 0.0 /100 | #346 | Tragic 90.2% |
| Spanish American Indians | 0.0 /100 | #347 | Tragic 89.8% |
Demographics Similar to Natives/Alaskans by 8th Grade
In terms of 8th grade, the demographic groups most similar to Natives/Alaskans are Immigrants from Sierra Leone (95.1%, a difference of 0.020%), Ethiopian (95.1%, a difference of 0.020%), Senegalese (95.2%, a difference of 0.030%), Immigrants from Africa (95.2%, a difference of 0.030%), and South American Indian (95.1%, a difference of 0.030%).
| Demographics | Rating | Rank | 8th Grade |
| Asians | 3.5 /100 | #231 | Tragic 95.2% |
| Indians (Asian) | 3.3 /100 | #232 | Tragic 95.2% |
| Immigrants | Asia | 3.1 /100 | #233 | Tragic 95.2% |
| Costa Ricans | 3.0 /100 | #234 | Tragic 95.2% |
| Nigerians | 2.9 /100 | #235 | Tragic 95.2% |
| Senegalese | 2.7 /100 | #236 | Tragic 95.2% |
| Immigrants | Africa | 2.7 /100 | #237 | Tragic 95.2% |
| Natives/Alaskans | 2.3 /100 | #238 | Tragic 95.2% |
| Immigrants | Sierra Leone | 2.1 /100 | #239 | Tragic 95.1% |
| Ethiopians | 2.0 /100 | #240 | Tragic 95.1% |
| South American Indians | 1.9 /100 | #241 | Tragic 95.1% |
| Tongans | 1.7 /100 | #242 | Tragic 95.1% |
| Paiute | 1.7 /100 | #243 | Tragic 95.1% |
| Immigrants | Middle Africa | 1.7 /100 | #244 | Tragic 95.1% |
| Jamaicans | 1.4 /100 | #245 | Tragic 95.1% |