Yakama vs Somali Nursery School
COMPARE
Yakama
Somali
Nursery School
Nursery School Comparison
Yakama
Somalis
96.6%
NURSERY SCHOOL
0.0/ 100
METRIC RATING
332nd/ 347
METRIC RANK
97.1%
NURSERY SCHOOL
0.0/ 100
METRIC RATING
305th/ 347
METRIC RANK
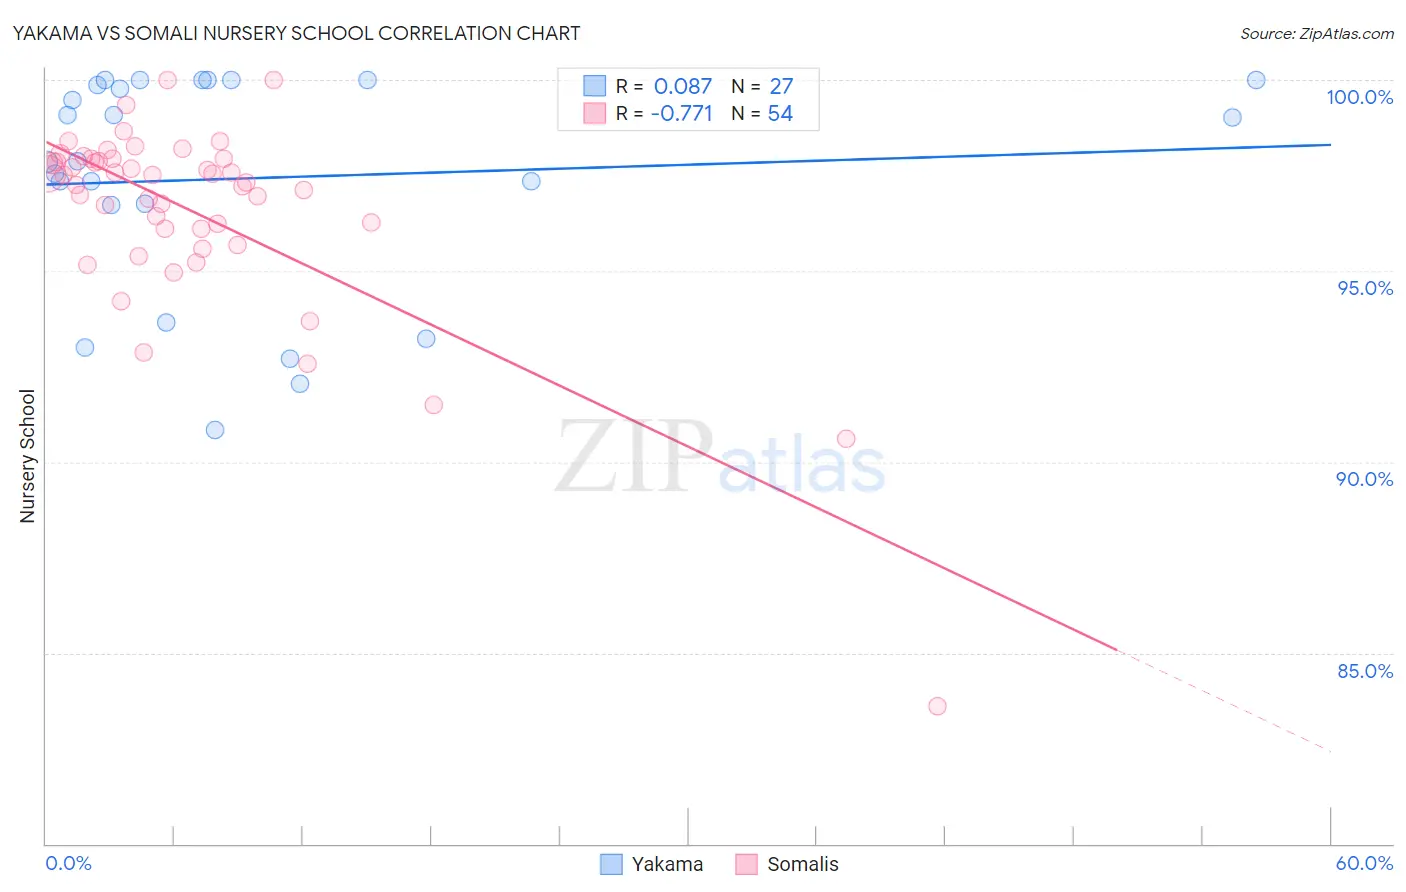
Yakama vs Somali Nursery School Correlation Chart
The statistical analysis conducted on geographies consisting of 19,923,144 people shows a slight positive correlation between the proportion of Yakama and percentage of population with at least nursery school education in the United States with a correlation coefficient (R) of 0.087 and weighted average of 96.6%. Similarly, the statistical analysis conducted on geographies consisting of 99,332,457 people shows a strong negative correlation between the proportion of Somalis and percentage of population with at least nursery school education in the United States with a correlation coefficient (R) of -0.771 and weighted average of 97.1%, a difference of 0.44%.
Nursery School Correlation Summary
| Measurement | Yakama | Somali |
| Minimum | 90.8% | 83.6% |
| Maximum | 100.0% | 100.0% |
| Range | 9.2% | 16.4% |
| Mean | 97.4% | 96.6% |
| Median | 97.9% | 97.4% |
| Interquartile 25% (IQ1) | 96.7% | 96.1% |
| Interquartile 75% (IQ3) | 100.0% | 97.9% |
| Interquartile Range (IQR) | 3.3% | 1.8% |
| Standard Deviation (Sample) | 2.9% | 2.6% |
| Standard Deviation (Population) | 2.8% | 2.6% |
Similar Demographics by Nursery School
Demographics Similar to Yakama by Nursery School
In terms of nursery school, the demographic groups most similar to Yakama are Immigrants from Armenia (96.7%, a difference of 0.020%), Central American (96.6%, a difference of 0.020%), Immigrants from Dominican Republic (96.6%, a difference of 0.030%), Japanese (96.7%, a difference of 0.040%), and Immigrants from Vietnam (96.7%, a difference of 0.050%).
| Demographics | Rating | Rank | Nursery School |
| Dominicans | 0.0 /100 | #325 | Tragic 96.8% |
| Indonesians | 0.0 /100 | #326 | Tragic 96.8% |
| Mexicans | 0.0 /100 | #327 | Tragic 96.8% |
| Immigrants | Latin America | 0.0 /100 | #328 | Tragic 96.7% |
| Immigrants | Vietnam | 0.0 /100 | #329 | Tragic 96.7% |
| Japanese | 0.0 /100 | #330 | Tragic 96.7% |
| Immigrants | Armenia | 0.0 /100 | #331 | Tragic 96.7% |
| Yakama | 0.0 /100 | #332 | Tragic 96.6% |
| Central Americans | 0.0 /100 | #333 | Tragic 96.6% |
| Immigrants | Dominican Republic | 0.0 /100 | #334 | Tragic 96.6% |
| Bangladeshis | 0.0 /100 | #335 | Tragic 96.6% |
| Guatemalans | 0.0 /100 | #336 | Tragic 96.6% |
| Immigrants | Cambodia | 0.0 /100 | #337 | Tragic 96.5% |
| Immigrants | Fiji | 0.0 /100 | #338 | Tragic 96.5% |
| Immigrants | Guatemala | 0.0 /100 | #339 | Tragic 96.4% |
Demographics Similar to Somalis by Nursery School
In terms of nursery school, the demographic groups most similar to Somalis are Ecuadorian (97.1%, a difference of 0.0%), Nicaraguan (97.1%, a difference of 0.010%), Immigrants from Caribbean (97.1%, a difference of 0.040%), Belizean (97.0%, a difference of 0.060%), and Immigrants from South Eastern Asia (97.1%, a difference of 0.070%).
| Demographics | Rating | Rank | Nursery School |
| Central American Indians | 0.0 /100 | #298 | Tragic 97.2% |
| Immigrants | Dominica | 0.0 /100 | #299 | Tragic 97.2% |
| Haitians | 0.0 /100 | #300 | Tragic 97.2% |
| Immigrants | South Eastern Asia | 0.0 /100 | #301 | Tragic 97.1% |
| Immigrants | Caribbean | 0.0 /100 | #302 | Tragic 97.1% |
| Nicaraguans | 0.0 /100 | #303 | Tragic 97.1% |
| Ecuadorians | 0.0 /100 | #304 | Tragic 97.1% |
| Somalis | 0.0 /100 | #305 | Tragic 97.1% |
| Belizeans | 0.0 /100 | #306 | Tragic 97.0% |
| Hispanics or Latinos | 0.0 /100 | #307 | Tragic 97.0% |
| Immigrants | Haiti | 0.0 /100 | #308 | Tragic 97.0% |
| Immigrants | Somalia | 0.0 /100 | #309 | Tragic 97.0% |
| Guyanese | 0.0 /100 | #310 | Tragic 97.0% |
| Immigrants | Azores | 0.0 /100 | #311 | Tragic 97.0% |
| Sri Lankans | 0.0 /100 | #312 | Tragic 97.0% |