Immigrants from Venezuela vs Somali Nursery School
COMPARE
Immigrants from Venezuela
Somali
Nursery School
Nursery School Comparison
Immigrants from Venezuela
Somalis
98.0%
NURSERY SCHOOL
49.8/ 100
METRIC RATING
176th/ 347
METRIC RANK
97.1%
NURSERY SCHOOL
0.0/ 100
METRIC RATING
305th/ 347
METRIC RANK
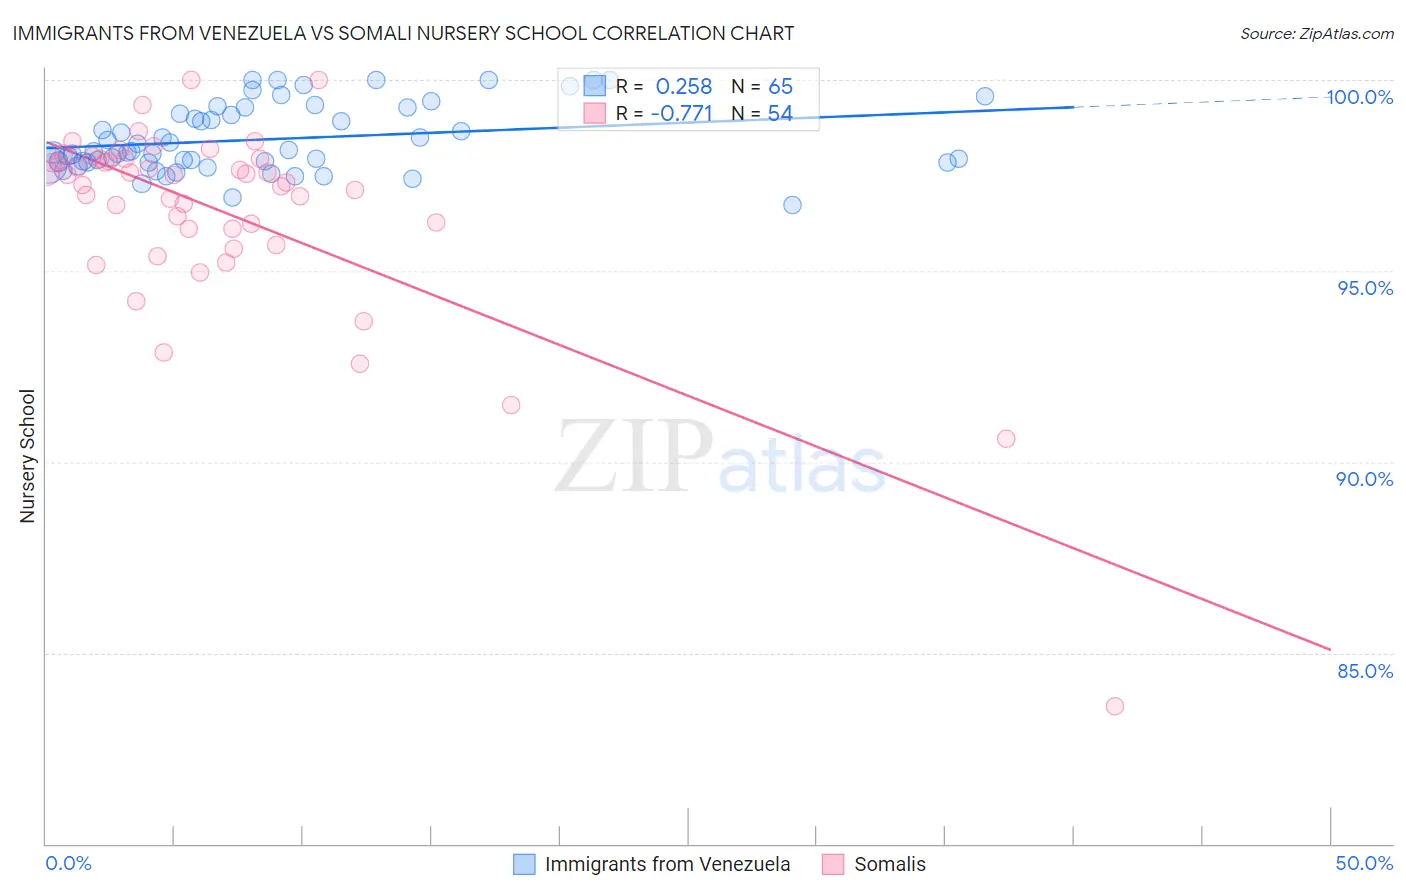
Immigrants from Venezuela vs Somali Nursery School Correlation Chart
The statistical analysis conducted on geographies consisting of 287,866,009 people shows a weak positive correlation between the proportion of Immigrants from Venezuela and percentage of population with at least nursery school education in the United States with a correlation coefficient (R) of 0.258 and weighted average of 98.0%. Similarly, the statistical analysis conducted on geographies consisting of 99,332,457 people shows a strong negative correlation between the proportion of Somalis and percentage of population with at least nursery school education in the United States with a correlation coefficient (R) of -0.771 and weighted average of 97.1%, a difference of 0.94%.
Nursery School Correlation Summary
| Measurement | Immigrants from Venezuela | Somali |
| Minimum | 96.7% | 83.6% |
| Maximum | 100.0% | 100.0% |
| Range | 3.3% | 16.4% |
| Mean | 98.4% | 96.6% |
| Median | 98.1% | 97.4% |
| Interquartile 25% (IQ1) | 97.8% | 96.1% |
| Interquartile 75% (IQ3) | 99.2% | 97.9% |
| Interquartile Range (IQR) | 1.4% | 1.8% |
| Standard Deviation (Sample) | 0.87% | 2.6% |
| Standard Deviation (Population) | 0.86% | 2.6% |
Similar Demographics by Nursery School
Demographics Similar to Immigrants from Venezuela by Nursery School
In terms of nursery school, the demographic groups most similar to Immigrants from Venezuela are Immigrants from Brazil (98.0%, a difference of 0.0%), Kenyan (98.0%, a difference of 0.0%), Navajo (98.0%, a difference of 0.0%), Immigrants from Sri Lanka (98.0%, a difference of 0.0%), and Albanian (98.0%, a difference of 0.0%).
| Demographics | Rating | Rank | Nursery School |
| Immigrants | Korea | 53.8 /100 | #169 | Average 98.0% |
| Bermudans | 53.7 /100 | #170 | Average 98.0% |
| Immigrants | Jordan | 53.4 /100 | #171 | Average 98.0% |
| Immigrants | Brazil | 51.3 /100 | #172 | Average 98.0% |
| Kenyans | 50.2 /100 | #173 | Average 98.0% |
| Navajo | 50.0 /100 | #174 | Average 98.0% |
| Immigrants | Sri Lanka | 49.9 /100 | #175 | Average 98.0% |
| Immigrants | Venezuela | 49.8 /100 | #176 | Average 98.0% |
| Albanians | 48.9 /100 | #177 | Average 98.0% |
| Natives/Alaskans | 48.6 /100 | #178 | Average 98.0% |
| Argentineans | 46.8 /100 | #179 | Average 98.0% |
| Immigrants | Bosnia and Herzegovina | 45.6 /100 | #180 | Average 98.0% |
| Egyptians | 42.8 /100 | #181 | Average 98.0% |
| Paiute | 42.0 /100 | #182 | Average 98.0% |
| Portuguese | 41.8 /100 | #183 | Average 98.0% |
Demographics Similar to Somalis by Nursery School
In terms of nursery school, the demographic groups most similar to Somalis are Ecuadorian (97.1%, a difference of 0.0%), Nicaraguan (97.1%, a difference of 0.010%), Immigrants from Caribbean (97.1%, a difference of 0.040%), Belizean (97.0%, a difference of 0.060%), and Immigrants from South Eastern Asia (97.1%, a difference of 0.070%).
| Demographics | Rating | Rank | Nursery School |
| Central American Indians | 0.0 /100 | #298 | Tragic 97.2% |
| Immigrants | Dominica | 0.0 /100 | #299 | Tragic 97.2% |
| Haitians | 0.0 /100 | #300 | Tragic 97.2% |
| Immigrants | South Eastern Asia | 0.0 /100 | #301 | Tragic 97.1% |
| Immigrants | Caribbean | 0.0 /100 | #302 | Tragic 97.1% |
| Nicaraguans | 0.0 /100 | #303 | Tragic 97.1% |
| Ecuadorians | 0.0 /100 | #304 | Tragic 97.1% |
| Somalis | 0.0 /100 | #305 | Tragic 97.1% |
| Belizeans | 0.0 /100 | #306 | Tragic 97.0% |
| Hispanics or Latinos | 0.0 /100 | #307 | Tragic 97.0% |
| Immigrants | Haiti | 0.0 /100 | #308 | Tragic 97.0% |
| Immigrants | Somalia | 0.0 /100 | #309 | Tragic 97.0% |
| Guyanese | 0.0 /100 | #310 | Tragic 97.0% |
| Immigrants | Azores | 0.0 /100 | #311 | Tragic 97.0% |
| Sri Lankans | 0.0 /100 | #312 | Tragic 97.0% |