Polish vs Somali Nursery School
COMPARE
Polish
Somali
Nursery School
Nursery School Comparison
Poles
Somalis
98.6%
NURSERY SCHOOL
100.0/ 100
METRIC RATING
23rd/ 347
METRIC RANK
97.1%
NURSERY SCHOOL
0.0/ 100
METRIC RATING
305th/ 347
METRIC RANK
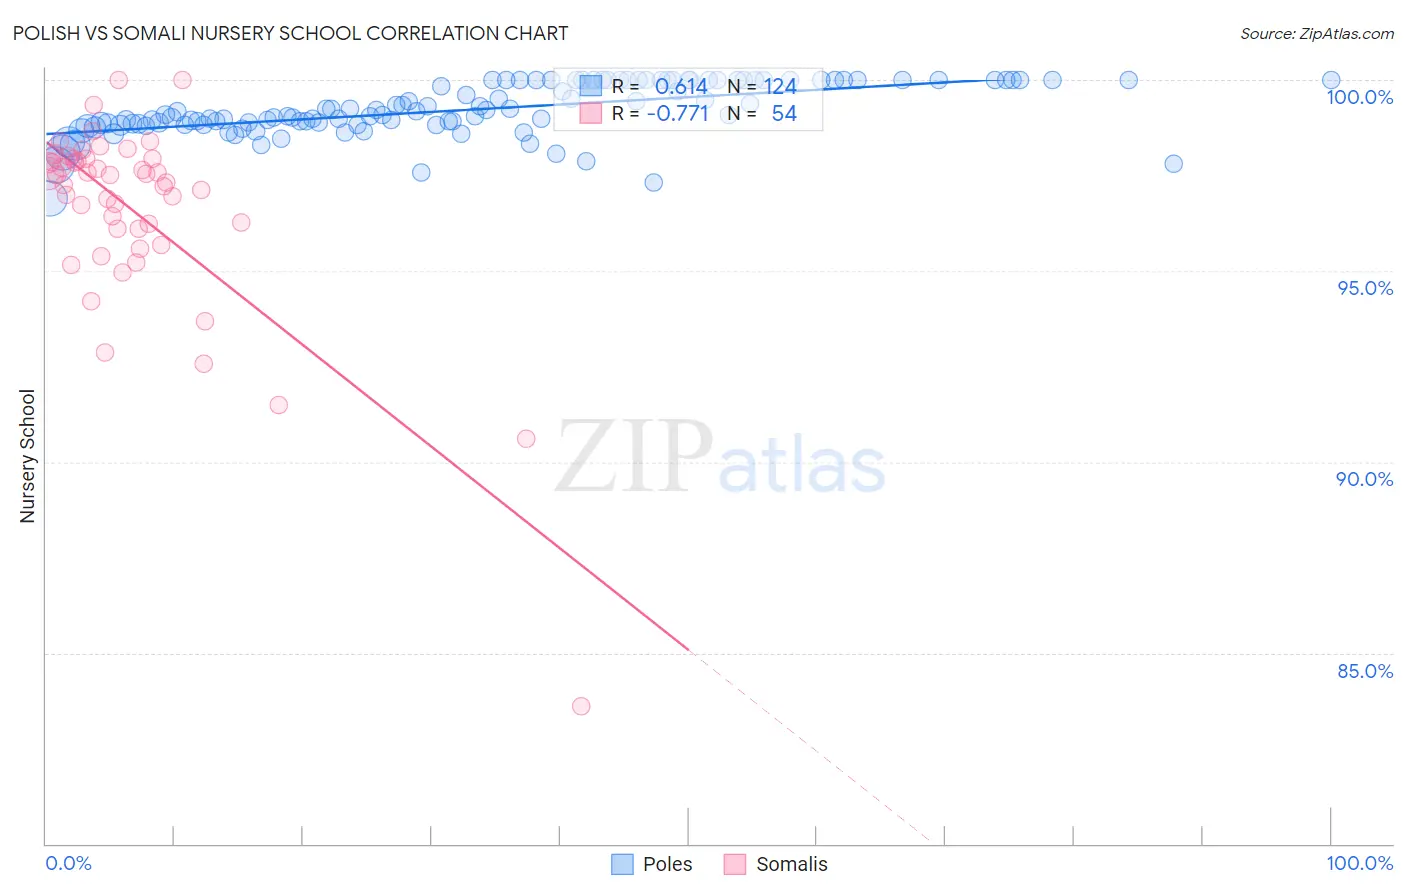
Polish vs Somali Nursery School Correlation Chart
The statistical analysis conducted on geographies consisting of 560,594,514 people shows a significant positive correlation between the proportion of Poles and percentage of population with at least nursery school education in the United States with a correlation coefficient (R) of 0.614 and weighted average of 98.6%. Similarly, the statistical analysis conducted on geographies consisting of 99,332,457 people shows a strong negative correlation between the proportion of Somalis and percentage of population with at least nursery school education in the United States with a correlation coefficient (R) of -0.771 and weighted average of 97.1%, a difference of 1.6%.
Nursery School Correlation Summary
| Measurement | Polish | Somali |
| Minimum | 96.9% | 83.6% |
| Maximum | 100.0% | 100.0% |
| Range | 3.1% | 16.4% |
| Mean | 99.2% | 96.6% |
| Median | 99.1% | 97.4% |
| Interquartile 25% (IQ1) | 98.8% | 96.1% |
| Interquartile 75% (IQ3) | 100.0% | 97.9% |
| Interquartile Range (IQR) | 1.2% | 1.8% |
| Standard Deviation (Sample) | 0.68% | 2.6% |
| Standard Deviation (Population) | 0.67% | 2.6% |
Similar Demographics by Nursery School
Demographics Similar to Poles by Nursery School
In terms of nursery school, the demographic groups most similar to Poles are Pennsylvania German (98.6%, a difference of 0.0%), Finnish (98.6%, a difference of 0.0%), Lithuanian (98.6%, a difference of 0.0%), Danish (98.6%, a difference of 0.0%), and Scotch-Irish (98.6%, a difference of 0.0%).
| Demographics | Rating | Rank | Nursery School |
| Scottish | 100.0 /100 | #16 | Exceptional 98.7% |
| Aleuts | 100.0 /100 | #17 | Exceptional 98.7% |
| Dutch | 100.0 /100 | #18 | Exceptional 98.7% |
| Irish | 100.0 /100 | #19 | Exceptional 98.6% |
| Pennsylvania Germans | 100.0 /100 | #20 | Exceptional 98.6% |
| Finns | 100.0 /100 | #21 | Exceptional 98.6% |
| Lithuanians | 100.0 /100 | #22 | Exceptional 98.6% |
| Poles | 100.0 /100 | #23 | Exceptional 98.6% |
| Danes | 100.0 /100 | #24 | Exceptional 98.6% |
| Scotch-Irish | 100.0 /100 | #25 | Exceptional 98.6% |
| Sioux | 100.0 /100 | #26 | Exceptional 98.6% |
| Arapaho | 100.0 /100 | #27 | Exceptional 98.6% |
| Croatians | 100.0 /100 | #28 | Exceptional 98.6% |
| French | 100.0 /100 | #29 | Exceptional 98.6% |
| Europeans | 100.0 /100 | #30 | Exceptional 98.6% |
Demographics Similar to Somalis by Nursery School
In terms of nursery school, the demographic groups most similar to Somalis are Ecuadorian (97.1%, a difference of 0.0%), Nicaraguan (97.1%, a difference of 0.010%), Immigrants from Caribbean (97.1%, a difference of 0.040%), Belizean (97.0%, a difference of 0.060%), and Immigrants from South Eastern Asia (97.1%, a difference of 0.070%).
| Demographics | Rating | Rank | Nursery School |
| Central American Indians | 0.0 /100 | #298 | Tragic 97.2% |
| Immigrants | Dominica | 0.0 /100 | #299 | Tragic 97.2% |
| Haitians | 0.0 /100 | #300 | Tragic 97.2% |
| Immigrants | South Eastern Asia | 0.0 /100 | #301 | Tragic 97.1% |
| Immigrants | Caribbean | 0.0 /100 | #302 | Tragic 97.1% |
| Nicaraguans | 0.0 /100 | #303 | Tragic 97.1% |
| Ecuadorians | 0.0 /100 | #304 | Tragic 97.1% |
| Somalis | 0.0 /100 | #305 | Tragic 97.1% |
| Belizeans | 0.0 /100 | #306 | Tragic 97.0% |
| Hispanics or Latinos | 0.0 /100 | #307 | Tragic 97.0% |
| Immigrants | Haiti | 0.0 /100 | #308 | Tragic 97.0% |
| Immigrants | Somalia | 0.0 /100 | #309 | Tragic 97.0% |
| Guyanese | 0.0 /100 | #310 | Tragic 97.0% |
| Immigrants | Azores | 0.0 /100 | #311 | Tragic 97.0% |
| Sri Lankans | 0.0 /100 | #312 | Tragic 97.0% |