Yakama vs Immigrants from Jordan Nursery School
COMPARE
Yakama
Immigrants from Jordan
Nursery School
Nursery School Comparison
Yakama
Immigrants from Jordan
96.6%
NURSERY SCHOOL
0.0/ 100
METRIC RATING
332nd/ 347
METRIC RANK
98.0%
NURSERY SCHOOL
53.4/ 100
METRIC RATING
171st/ 347
METRIC RANK
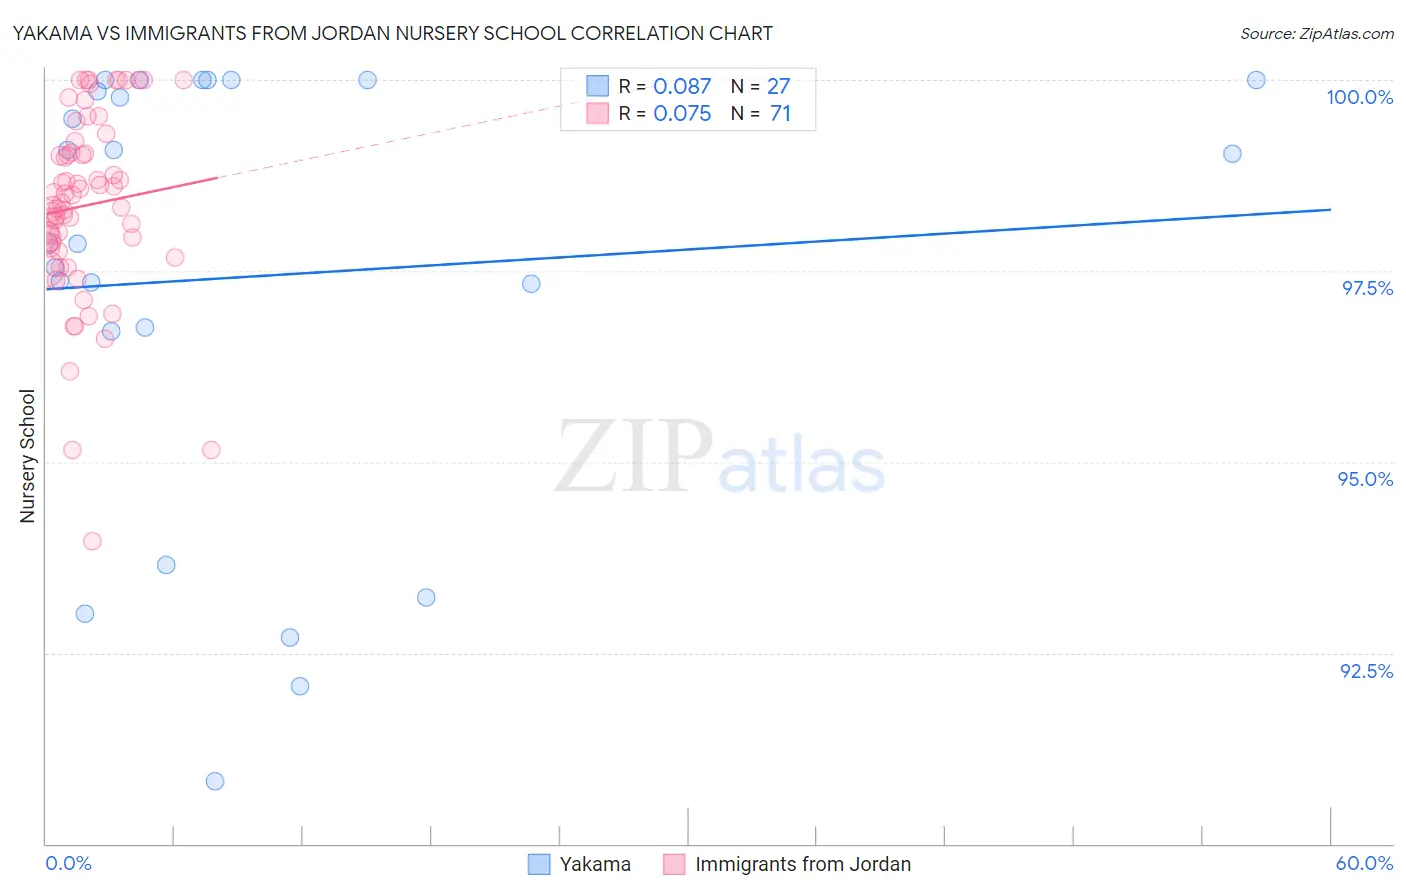
Yakama vs Immigrants from Jordan Nursery School Correlation Chart
The statistical analysis conducted on geographies consisting of 19,923,144 people shows a slight positive correlation between the proportion of Yakama and percentage of population with at least nursery school education in the United States with a correlation coefficient (R) of 0.087 and weighted average of 96.6%. Similarly, the statistical analysis conducted on geographies consisting of 181,269,915 people shows a slight positive correlation between the proportion of Immigrants from Jordan and percentage of population with at least nursery school education in the United States with a correlation coefficient (R) of 0.075 and weighted average of 98.0%, a difference of 1.4%.
Nursery School Correlation Summary
| Measurement | Yakama | Immigrants from Jordan |
| Minimum | 90.8% | 94.0% |
| Maximum | 100.0% | 100.0% |
| Range | 9.2% | 6.0% |
| Mean | 97.4% | 98.4% |
| Median | 97.9% | 98.4% |
| Interquartile 25% (IQ1) | 96.7% | 97.8% |
| Interquartile 75% (IQ3) | 100.0% | 99.1% |
| Interquartile Range (IQR) | 3.3% | 1.3% |
| Standard Deviation (Sample) | 2.9% | 1.2% |
| Standard Deviation (Population) | 2.8% | 1.2% |
Similar Demographics by Nursery School
Demographics Similar to Yakama by Nursery School
In terms of nursery school, the demographic groups most similar to Yakama are Immigrants from Armenia (96.7%, a difference of 0.020%), Central American (96.6%, a difference of 0.020%), Immigrants from Dominican Republic (96.6%, a difference of 0.030%), Japanese (96.7%, a difference of 0.040%), and Immigrants from Vietnam (96.7%, a difference of 0.050%).
| Demographics | Rating | Rank | Nursery School |
| Dominicans | 0.0 /100 | #325 | Tragic 96.8% |
| Indonesians | 0.0 /100 | #326 | Tragic 96.8% |
| Mexicans | 0.0 /100 | #327 | Tragic 96.8% |
| Immigrants | Latin America | 0.0 /100 | #328 | Tragic 96.7% |
| Immigrants | Vietnam | 0.0 /100 | #329 | Tragic 96.7% |
| Japanese | 0.0 /100 | #330 | Tragic 96.7% |
| Immigrants | Armenia | 0.0 /100 | #331 | Tragic 96.7% |
| Yakama | 0.0 /100 | #332 | Tragic 96.6% |
| Central Americans | 0.0 /100 | #333 | Tragic 96.6% |
| Immigrants | Dominican Republic | 0.0 /100 | #334 | Tragic 96.6% |
| Bangladeshis | 0.0 /100 | #335 | Tragic 96.6% |
| Guatemalans | 0.0 /100 | #336 | Tragic 96.6% |
| Immigrants | Cambodia | 0.0 /100 | #337 | Tragic 96.5% |
| Immigrants | Fiji | 0.0 /100 | #338 | Tragic 96.5% |
| Immigrants | Guatemala | 0.0 /100 | #339 | Tragic 96.4% |
Demographics Similar to Immigrants from Jordan by Nursery School
In terms of nursery school, the demographic groups most similar to Immigrants from Jordan are Immigrants from Korea (98.0%, a difference of 0.0%), Bermudan (98.0%, a difference of 0.0%), Ugandan (98.0%, a difference of 0.010%), Chilean (98.0%, a difference of 0.010%), and Spanish American (98.0%, a difference of 0.010%).
| Demographics | Rating | Rank | Nursery School |
| Ugandans | 56.4 /100 | #164 | Average 98.0% |
| Chileans | 56.4 /100 | #165 | Average 98.0% |
| Spanish Americans | 55.6 /100 | #166 | Average 98.0% |
| Immigrants | Spain | 55.6 /100 | #167 | Average 98.0% |
| Immigrants | Micronesia | 55.0 /100 | #168 | Average 98.0% |
| Immigrants | Korea | 53.8 /100 | #169 | Average 98.0% |
| Bermudans | 53.7 /100 | #170 | Average 98.0% |
| Immigrants | Jordan | 53.4 /100 | #171 | Average 98.0% |
| Immigrants | Brazil | 51.3 /100 | #172 | Average 98.0% |
| Kenyans | 50.2 /100 | #173 | Average 98.0% |
| Navajo | 50.0 /100 | #174 | Average 98.0% |
| Immigrants | Sri Lanka | 49.9 /100 | #175 | Average 98.0% |
| Immigrants | Venezuela | 49.8 /100 | #176 | Average 98.0% |
| Albanians | 48.9 /100 | #177 | Average 98.0% |
| Natives/Alaskans | 48.6 /100 | #178 | Average 98.0% |