Yakama vs Korean Nursery School
COMPARE
Yakama
Korean
Nursery School
Nursery School Comparison
Yakama
Koreans
96.6%
NURSERY SCHOOL
0.0/ 100
METRIC RATING
332nd/ 347
METRIC RANK
97.7%
NURSERY SCHOOL
1.4/ 100
METRIC RATING
240th/ 347
METRIC RANK
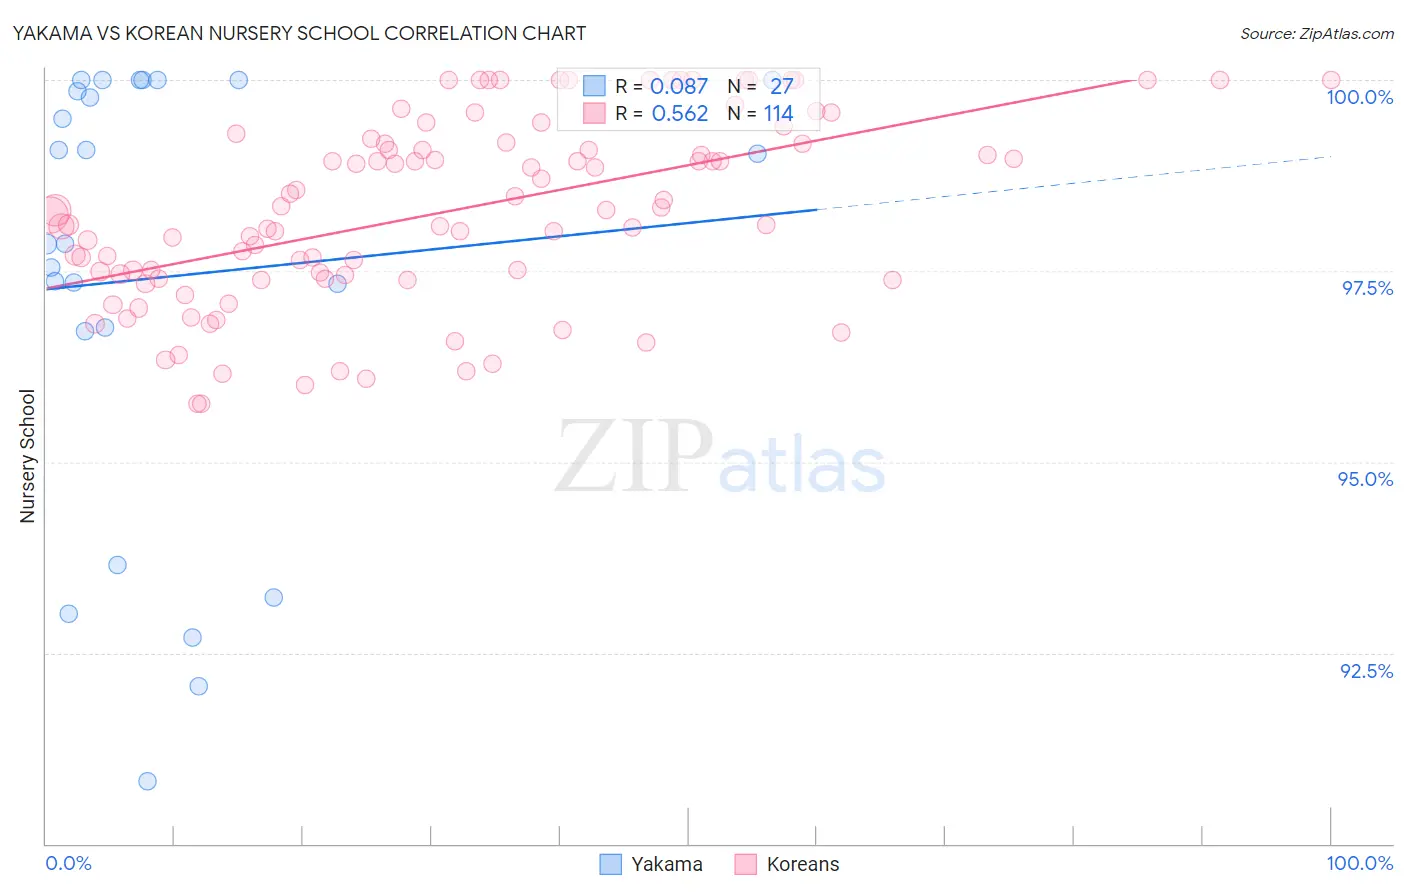
Yakama vs Korean Nursery School Correlation Chart
The statistical analysis conducted on geographies consisting of 19,923,144 people shows a slight positive correlation between the proportion of Yakama and percentage of population with at least nursery school education in the United States with a correlation coefficient (R) of 0.087 and weighted average of 96.6%. Similarly, the statistical analysis conducted on geographies consisting of 510,935,951 people shows a substantial positive correlation between the proportion of Koreans and percentage of population with at least nursery school education in the United States with a correlation coefficient (R) of 0.562 and weighted average of 97.7%, a difference of 1.1%.
Nursery School Correlation Summary
| Measurement | Yakama | Korean |
| Minimum | 90.8% | 95.8% |
| Maximum | 100.0% | 100.0% |
| Range | 9.2% | 4.2% |
| Mean | 97.4% | 98.3% |
| Median | 97.9% | 98.3% |
| Interquartile 25% (IQ1) | 96.7% | 97.4% |
| Interquartile 75% (IQ3) | 100.0% | 99.2% |
| Interquartile Range (IQR) | 3.3% | 1.8% |
| Standard Deviation (Sample) | 2.9% | 1.2% |
| Standard Deviation (Population) | 2.8% | 1.2% |
Similar Demographics by Nursery School
Demographics Similar to Yakama by Nursery School
In terms of nursery school, the demographic groups most similar to Yakama are Immigrants from Armenia (96.7%, a difference of 0.020%), Central American (96.6%, a difference of 0.020%), Immigrants from Dominican Republic (96.6%, a difference of 0.030%), Japanese (96.7%, a difference of 0.040%), and Immigrants from Vietnam (96.7%, a difference of 0.050%).
| Demographics | Rating | Rank | Nursery School |
| Dominicans | 0.0 /100 | #325 | Tragic 96.8% |
| Indonesians | 0.0 /100 | #326 | Tragic 96.8% |
| Mexicans | 0.0 /100 | #327 | Tragic 96.8% |
| Immigrants | Latin America | 0.0 /100 | #328 | Tragic 96.7% |
| Immigrants | Vietnam | 0.0 /100 | #329 | Tragic 96.7% |
| Japanese | 0.0 /100 | #330 | Tragic 96.7% |
| Immigrants | Armenia | 0.0 /100 | #331 | Tragic 96.7% |
| Yakama | 0.0 /100 | #332 | Tragic 96.6% |
| Central Americans | 0.0 /100 | #333 | Tragic 96.6% |
| Immigrants | Dominican Republic | 0.0 /100 | #334 | Tragic 96.6% |
| Bangladeshis | 0.0 /100 | #335 | Tragic 96.6% |
| Guatemalans | 0.0 /100 | #336 | Tragic 96.6% |
| Immigrants | Cambodia | 0.0 /100 | #337 | Tragic 96.5% |
| Immigrants | Fiji | 0.0 /100 | #338 | Tragic 96.5% |
| Immigrants | Guatemala | 0.0 /100 | #339 | Tragic 96.4% |
Demographics Similar to Koreans by Nursery School
In terms of nursery school, the demographic groups most similar to Koreans are Nigerian (97.7%, a difference of 0.010%), Immigrants from Eastern Asia (97.7%, a difference of 0.010%), Immigrants from Malaysia (97.7%, a difference of 0.020%), Immigrants from Western Asia (97.7%, a difference of 0.020%), and Immigrants from Indonesia (97.7%, a difference of 0.020%).
| Demographics | Rating | Rank | Nursery School |
| U.S. Virgin Islanders | 2.1 /100 | #233 | Tragic 97.7% |
| Colombians | 2.1 /100 | #234 | Tragic 97.7% |
| Immigrants | Pakistan | 2.1 /100 | #235 | Tragic 97.7% |
| Immigrants | Malaysia | 1.9 /100 | #236 | Tragic 97.7% |
| Immigrants | Western Asia | 1.9 /100 | #237 | Tragic 97.7% |
| Nigerians | 1.7 /100 | #238 | Tragic 97.7% |
| Immigrants | Eastern Asia | 1.6 /100 | #239 | Tragic 97.7% |
| Koreans | 1.4 /100 | #240 | Tragic 97.7% |
| Immigrants | Indonesia | 1.1 /100 | #241 | Tragic 97.7% |
| Liberians | 1.1 /100 | #242 | Tragic 97.7% |
| Asians | 1.1 /100 | #243 | Tragic 97.6% |
| South Americans | 1.0 /100 | #244 | Tragic 97.6% |
| Bolivians | 1.0 /100 | #245 | Tragic 97.6% |
| Peruvians | 1.0 /100 | #246 | Tragic 97.6% |
| Immigrants | Middle Africa | 0.9 /100 | #247 | Tragic 97.6% |