Dutch vs Moroccan College, 1 year or more
COMPARE
Dutch
Moroccan
College, 1 year or more
College, 1 year or more Comparison
Dutch
Moroccans
58.6%
COLLEGE, 1 YEAR OR MORE
26.2/ 100
METRIC RATING
195th/ 347
METRIC RANK
60.2%
COLLEGE, 1 YEAR OR MORE
72.9/ 100
METRIC RATING
155th/ 347
METRIC RANK
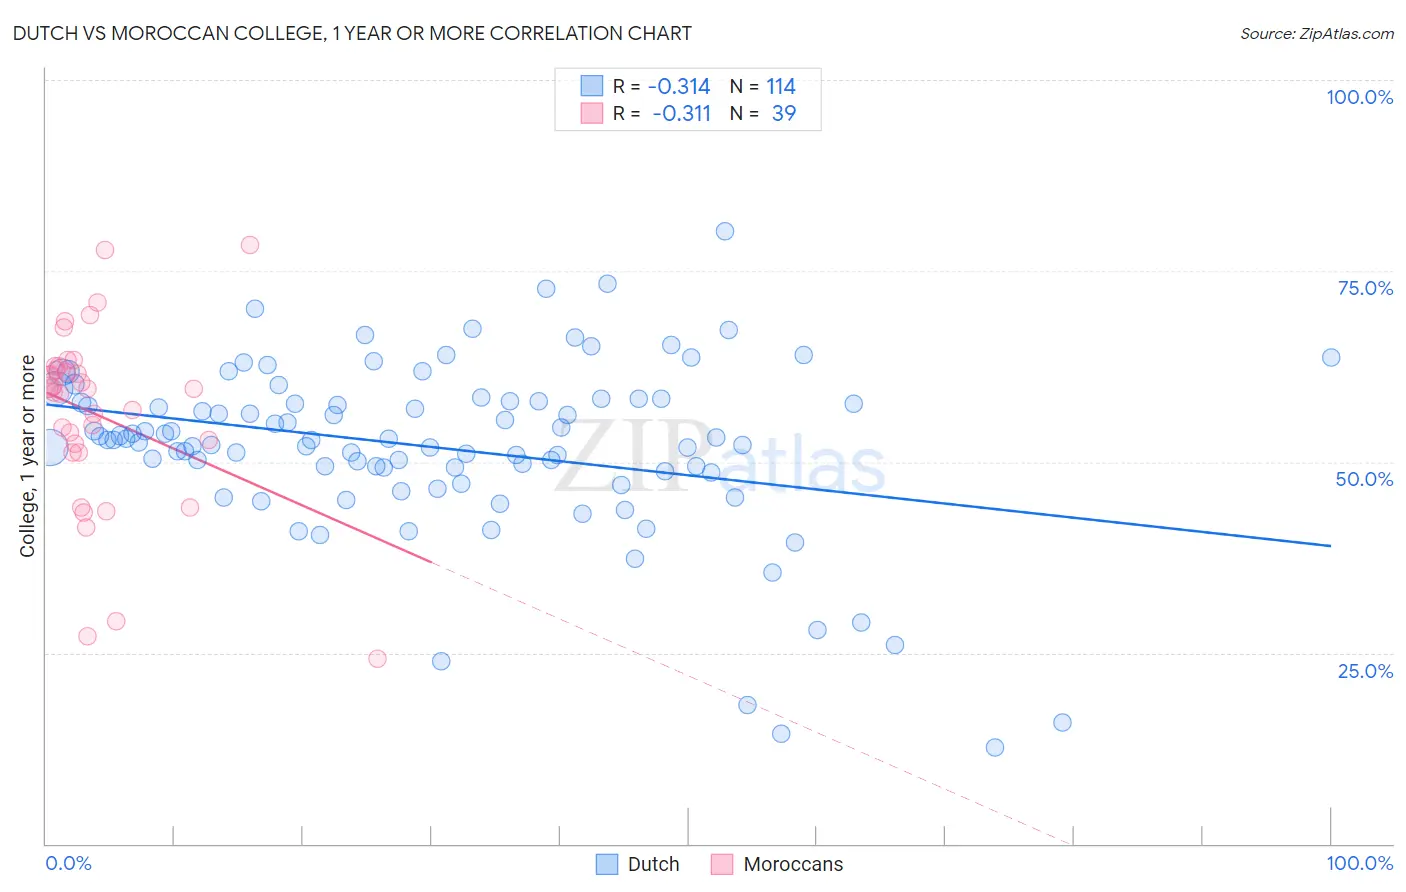
Dutch vs Moroccan College, 1 year or more Correlation Chart
The statistical analysis conducted on geographies consisting of 554,349,902 people shows a mild negative correlation between the proportion of Dutch and percentage of population with at least college, 1 year or more education in the United States with a correlation coefficient (R) of -0.314 and weighted average of 58.6%. Similarly, the statistical analysis conducted on geographies consisting of 201,817,667 people shows a mild negative correlation between the proportion of Moroccans and percentage of population with at least college, 1 year or more education in the United States with a correlation coefficient (R) of -0.311 and weighted average of 60.2%, a difference of 2.7%.
College, 1 year or more Correlation Summary
| Measurement | Dutch | Moroccan |
| Minimum | 12.6% | 24.2% |
| Maximum | 80.2% | 78.5% |
| Range | 67.6% | 54.2% |
| Mean | 51.9% | 56.1% |
| Median | 52.9% | 59.6% |
| Interquartile 25% (IQ1) | 48.7% | 51.3% |
| Interquartile 75% (IQ3) | 58.0% | 62.5% |
| Interquartile Range (IQR) | 9.3% | 11.2% |
| Standard Deviation (Sample) | 11.6% | 12.1% |
| Standard Deviation (Population) | 11.5% | 11.9% |
Similar Demographics by College, 1 year or more
Demographics Similar to Dutch by College, 1 year or more
In terms of college, 1 year or more, the demographic groups most similar to Dutch are Guamanian/Chamorro (58.6%, a difference of 0.0%), Immigrants from Thailand (58.6%, a difference of 0.010%), Costa Rican (58.6%, a difference of 0.020%), Immigrants from South Eastern Asia (58.5%, a difference of 0.080%), and Peruvian (58.6%, a difference of 0.090%).
| Demographics | Rating | Rank | College, 1 year or more |
| French | 34.4 /100 | #188 | Fair 58.9% |
| Uruguayans | 31.8 /100 | #189 | Fair 58.8% |
| Immigrants | Cameroon | 31.2 /100 | #190 | Fair 58.8% |
| Immigrants | Philippines | 29.2 /100 | #191 | Fair 58.7% |
| Colombians | 27.6 /100 | #192 | Fair 58.7% |
| Peruvians | 27.5 /100 | #193 | Fair 58.6% |
| Costa Ricans | 26.4 /100 | #194 | Fair 58.6% |
| Dutch | 26.2 /100 | #195 | Fair 58.6% |
| Guamanians/Chamorros | 26.2 /100 | #196 | Fair 58.6% |
| Immigrants | Thailand | 26.0 /100 | #197 | Fair 58.6% |
| Immigrants | South Eastern Asia | 25.1 /100 | #198 | Fair 58.5% |
| Slovaks | 24.6 /100 | #199 | Fair 58.5% |
| Spanish | 24.2 /100 | #200 | Fair 58.5% |
| Nigerians | 23.0 /100 | #201 | Fair 58.5% |
| Immigrants | South America | 21.9 /100 | #202 | Fair 58.4% |
Demographics Similar to Moroccans by College, 1 year or more
In terms of college, 1 year or more, the demographic groups most similar to Moroccans are Sudanese (60.2%, a difference of 0.0%), Finnish (60.2%, a difference of 0.0%), Sierra Leonean (60.2%, a difference of 0.080%), Immigrants from Germany (60.3%, a difference of 0.22%), and Immigrants from Armenia (60.0%, a difference of 0.26%).
| Demographics | Rating | Rank | College, 1 year or more |
| Kenyans | 79.0 /100 | #148 | Good 60.5% |
| Brazilians | 79.0 /100 | #149 | Good 60.5% |
| Immigrants | Sudan | 77.8 /100 | #150 | Good 60.4% |
| Albanians | 77.8 /100 | #151 | Good 60.4% |
| Immigrants | Germany | 76.1 /100 | #152 | Good 60.3% |
| Sierra Leoneans | 74.1 /100 | #153 | Good 60.2% |
| Sudanese | 73.0 /100 | #154 | Good 60.2% |
| Moroccans | 72.9 /100 | #155 | Good 60.2% |
| Finns | 72.9 /100 | #156 | Good 60.2% |
| Immigrants | Armenia | 68.8 /100 | #157 | Good 60.0% |
| English | 67.2 /100 | #158 | Good 60.0% |
| Immigrants | Iraq | 67.0 /100 | #159 | Good 60.0% |
| South American Indians | 66.9 /100 | #160 | Good 60.0% |
| Somalis | 64.5 /100 | #161 | Good 59.9% |
| Koreans | 58.5 /100 | #162 | Average 59.7% |