Yakama vs Scottish High School Diploma
COMPARE
Yakama
Scottish
High School Diploma
High School Diploma Comparison
Yakama
Scottish
80.0%
HIGH SCHOOL DIPLOMA
0.0/ 100
METRIC RATING
345th/ 347
METRIC RANK
91.4%
HIGH SCHOOL DIPLOMA
99.9/ 100
METRIC RATING
34th/ 347
METRIC RANK
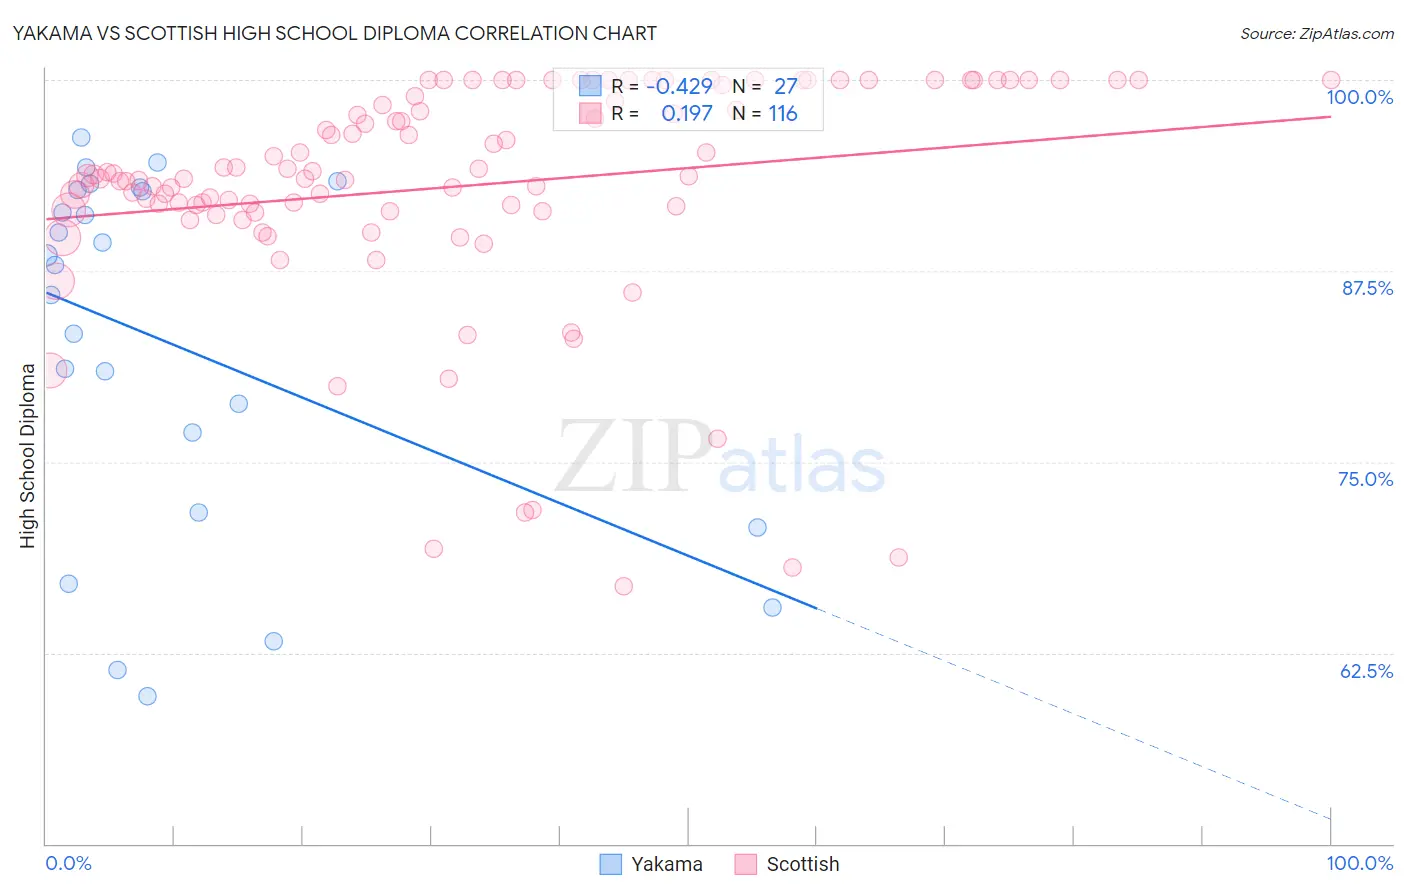
Yakama vs Scottish High School Diploma Correlation Chart
The statistical analysis conducted on geographies consisting of 19,923,144 people shows a moderate negative correlation between the proportion of Yakama and percentage of population with at least high school diploma education in the United States with a correlation coefficient (R) of -0.429 and weighted average of 80.0%. Similarly, the statistical analysis conducted on geographies consisting of 567,141,165 people shows a poor positive correlation between the proportion of Scottish and percentage of population with at least high school diploma education in the United States with a correlation coefficient (R) of 0.197 and weighted average of 91.4%, a difference of 14.2%.
High School Diploma Correlation Summary
| Measurement | Yakama | Scottish |
| Minimum | 59.7% | 66.9% |
| Maximum | 96.3% | 100.0% |
| Range | 36.6% | 33.1% |
| Mean | 82.8% | 93.0% |
| Median | 87.9% | 93.7% |
| Interquartile 25% (IQ1) | 71.7% | 91.5% |
| Interquartile 75% (IQ3) | 92.8% | 99.3% |
| Interquartile Range (IQR) | 21.1% | 7.8% |
| Standard Deviation (Sample) | 11.7% | 7.4% |
| Standard Deviation (Population) | 11.4% | 7.4% |
Similar Demographics by High School Diploma
Demographics Similar to Yakama by High School Diploma
In terms of high school diploma, the demographic groups most similar to Yakama are Immigrants from Central America (80.1%, a difference of 0.16%), Spanish American Indian (79.8%, a difference of 0.29%), Immigrants from Mexico (79.5%, a difference of 0.56%), Immigrants from El Salvador (80.8%, a difference of 1.0%), and Immigrants from Guatemala (81.4%, a difference of 1.7%).
| Demographics | Rating | Rank | High School Diploma |
| Immigrants | Latin America | 0.0 /100 | #333 | Tragic 82.1% |
| Tohono O'odham | 0.0 /100 | #334 | Tragic 82.1% |
| Guatemalans | 0.0 /100 | #335 | Tragic 82.0% |
| Immigrants | Dominican Republic | 0.0 /100 | #336 | Tragic 82.0% |
| Immigrants | Yemen | 0.0 /100 | #337 | Tragic 81.8% |
| Salvadorans | 0.0 /100 | #338 | Tragic 81.7% |
| Pima | 0.0 /100 | #339 | Tragic 81.6% |
| Houma | 0.0 /100 | #340 | Tragic 81.5% |
| Mexicans | 0.0 /100 | #341 | Tragic 81.4% |
| Immigrants | Guatemala | 0.0 /100 | #342 | Tragic 81.4% |
| Immigrants | El Salvador | 0.0 /100 | #343 | Tragic 80.8% |
| Immigrants | Central America | 0.0 /100 | #344 | Tragic 80.1% |
| Yakama | 0.0 /100 | #345 | Tragic 80.0% |
| Spanish American Indians | 0.0 /100 | #346 | Tragic 79.8% |
| Immigrants | Mexico | 0.0 /100 | #347 | Tragic 79.5% |
Demographics Similar to Scottish by High School Diploma
In terms of high school diploma, the demographic groups most similar to Scottish are English (91.4%, a difference of 0.010%), Okinawan (91.4%, a difference of 0.010%), Iranian (91.4%, a difference of 0.020%), Immigrants from Northern Europe (91.4%, a difference of 0.020%), and European (91.4%, a difference of 0.030%).
| Demographics | Rating | Rank | High School Diploma |
| Cypriots | 99.9 /100 | #27 | Exceptional 91.5% |
| Tlingit-Haida | 99.9 /100 | #28 | Exceptional 91.4% |
| Europeans | 99.9 /100 | #29 | Exceptional 91.4% |
| Iranians | 99.9 /100 | #30 | Exceptional 91.4% |
| Immigrants | Northern Europe | 99.9 /100 | #31 | Exceptional 91.4% |
| English | 99.9 /100 | #32 | Exceptional 91.4% |
| Okinawans | 99.9 /100 | #33 | Exceptional 91.4% |
| Scottish | 99.9 /100 | #34 | Exceptional 91.4% |
| Irish | 99.9 /100 | #35 | Exceptional 91.4% |
| Tsimshian | 99.9 /100 | #36 | Exceptional 91.3% |
| Immigrants | Ireland | 99.9 /100 | #37 | Exceptional 91.3% |
| Immigrants | Scotland | 99.8 /100 | #38 | Exceptional 91.3% |
| Dutch | 99.8 /100 | #39 | Exceptional 91.3% |
| Immigrants | Lithuania | 99.8 /100 | #40 | Exceptional 91.3% |
| Immigrants | Australia | 99.8 /100 | #41 | Exceptional 91.3% |