Jamaican vs Immigrants from Denmark 11th Grade
COMPARE
Jamaican
Immigrants from Denmark
11th Grade
11th Grade Comparison
Jamaicans
Immigrants from Denmark
91.4%
11TH GRADE
0.6/ 100
METRIC RATING
259th/ 347
METRIC RANK
93.7%
11TH GRADE
99.5/ 100
METRIC RATING
79th/ 347
METRIC RANK
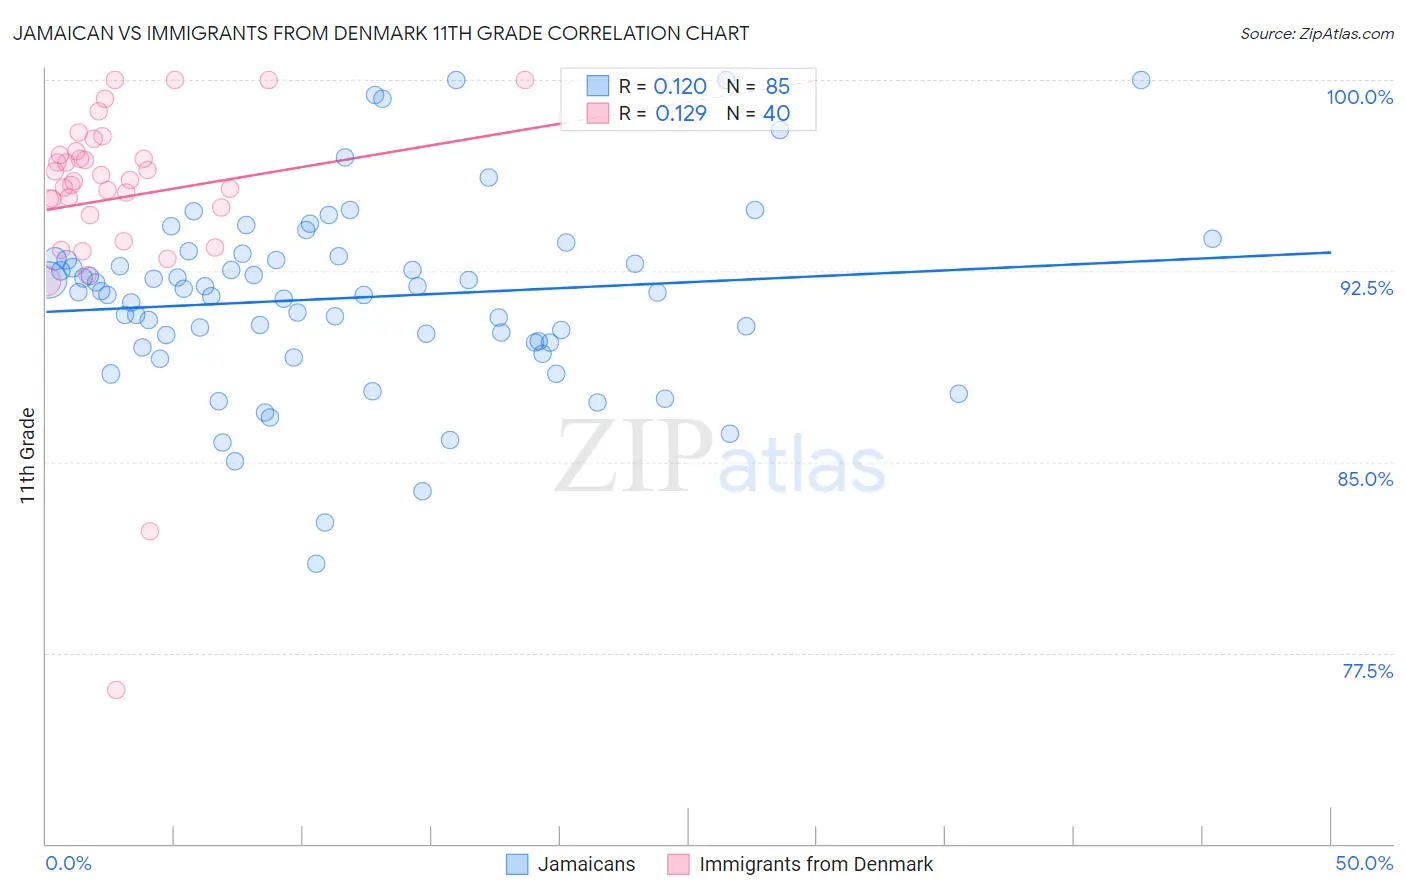
Jamaican vs Immigrants from Denmark 11th Grade Correlation Chart
The statistical analysis conducted on geographies consisting of 368,084,732 people shows a poor positive correlation between the proportion of Jamaicans and percentage of population with at least 11th grade education in the United States with a correlation coefficient (R) of 0.120 and weighted average of 91.4%. Similarly, the statistical analysis conducted on geographies consisting of 136,430,715 people shows a poor positive correlation between the proportion of Immigrants from Denmark and percentage of population with at least 11th grade education in the United States with a correlation coefficient (R) of 0.129 and weighted average of 93.7%, a difference of 2.6%.
11th Grade Correlation Summary
| Measurement | Jamaican | Immigrants from Denmark |
| Minimum | 81.0% | 76.1% |
| Maximum | 100.0% | 100.0% |
| Range | 19.0% | 23.9% |
| Mean | 91.4% | 95.4% |
| Median | 91.7% | 96.0% |
| Interquartile 25% (IQ1) | 89.7% | 94.8% |
| Interquartile 75% (IQ3) | 93.0% | 97.1% |
| Interquartile Range (IQR) | 3.4% | 2.3% |
| Standard Deviation (Sample) | 3.6% | 4.4% |
| Standard Deviation (Population) | 3.6% | 4.3% |
Similar Demographics by 11th Grade
Demographics Similar to Jamaicans by 11th Grade
In terms of 11th grade, the demographic groups most similar to Jamaicans are Immigrants from Colombia (91.4%, a difference of 0.010%), Spanish American (91.4%, a difference of 0.010%), Taiwanese (91.3%, a difference of 0.010%), Cajun (91.4%, a difference of 0.030%), and Immigrants from Uruguay (91.3%, a difference of 0.030%).
| Demographics | Rating | Rank | 11th Grade |
| Immigrants | Nigeria | 0.8 /100 | #252 | Tragic 91.4% |
| Immigrants | South America | 0.8 /100 | #253 | Tragic 91.4% |
| Immigrants | Eritrea | 0.7 /100 | #254 | Tragic 91.4% |
| Blacks/African Americans | 0.7 /100 | #255 | Tragic 91.4% |
| Immigrants | Senegal | 0.7 /100 | #256 | Tragic 91.4% |
| Cajuns | 0.7 /100 | #257 | Tragic 91.4% |
| Immigrants | Colombia | 0.6 /100 | #258 | Tragic 91.4% |
| Jamaicans | 0.6 /100 | #259 | Tragic 91.4% |
| Spanish Americans | 0.6 /100 | #260 | Tragic 91.4% |
| Taiwanese | 0.6 /100 | #261 | Tragic 91.3% |
| Immigrants | Uruguay | 0.5 /100 | #262 | Tragic 91.3% |
| Immigrants | Ghana | 0.3 /100 | #263 | Tragic 91.2% |
| Yup'ik | 0.3 /100 | #264 | Tragic 91.2% |
| Pueblo | 0.3 /100 | #265 | Tragic 91.2% |
| Immigrants | Western Africa | 0.3 /100 | #266 | Tragic 91.2% |
Demographics Similar to Immigrants from Denmark by 11th Grade
In terms of 11th grade, the demographic groups most similar to Immigrants from Denmark are Celtic (93.7%, a difference of 0.010%), Aleut (93.7%, a difference of 0.010%), Soviet Union (93.7%, a difference of 0.010%), Canadian (93.7%, a difference of 0.020%), and Immigrants from Moldova (93.7%, a difference of 0.020%).
| Demographics | Rating | Rank | 11th Grade |
| Immigrants | Japan | 99.7 /100 | #72 | Exceptional 93.8% |
| Romanians | 99.6 /100 | #73 | Exceptional 93.8% |
| Immigrants | Czechoslovakia | 99.6 /100 | #74 | Exceptional 93.8% |
| Immigrants | Latvia | 99.6 /100 | #75 | Exceptional 93.8% |
| Celtics | 99.5 /100 | #76 | Exceptional 93.7% |
| Aleuts | 99.5 /100 | #77 | Exceptional 93.7% |
| Soviet Union | 99.5 /100 | #78 | Exceptional 93.7% |
| Immigrants | Denmark | 99.5 /100 | #79 | Exceptional 93.7% |
| Canadians | 99.5 /100 | #80 | Exceptional 93.7% |
| Immigrants | Moldova | 99.5 /100 | #81 | Exceptional 93.7% |
| Immigrants | Saudi Arabia | 99.3 /100 | #82 | Exceptional 93.7% |
| Icelanders | 99.3 /100 | #83 | Exceptional 93.6% |
| Immigrants | Taiwan | 99.3 /100 | #84 | Exceptional 93.6% |
| Immigrants | Switzerland | 99.3 /100 | #85 | Exceptional 93.6% |
| Immigrants | South Central Asia | 99.2 /100 | #86 | Exceptional 93.6% |