West Indian vs Immigrants from Ecuador 8th Grade
COMPARE
West Indian
Immigrants from Ecuador
8th Grade
8th Grade Comparison
West Indians
Immigrants from Ecuador
94.8%
8TH GRADE
0.3/ 100
METRIC RATING
266th/ 347
METRIC RANK
93.3%
8TH GRADE
0.0/ 100
METRIC RATING
317th/ 347
METRIC RANK
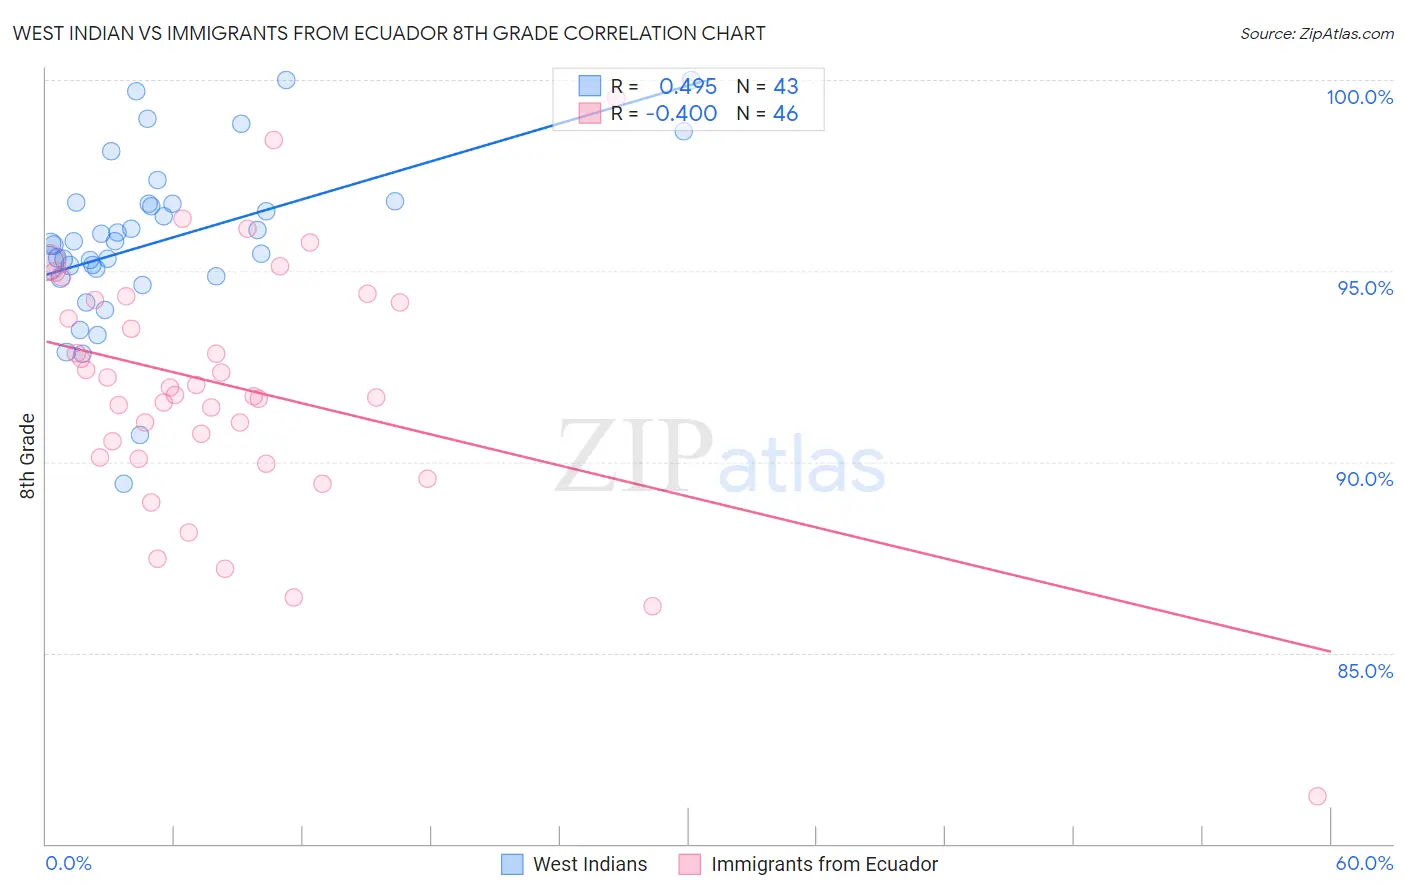
West Indian vs Immigrants from Ecuador 8th Grade Correlation Chart
The statistical analysis conducted on geographies consisting of 254,059,006 people shows a moderate positive correlation between the proportion of West Indians and percentage of population with at least 8th grade education in the United States with a correlation coefficient (R) of 0.495 and weighted average of 94.8%. Similarly, the statistical analysis conducted on geographies consisting of 270,907,929 people shows a moderate negative correlation between the proportion of Immigrants from Ecuador and percentage of population with at least 8th grade education in the United States with a correlation coefficient (R) of -0.400 and weighted average of 93.3%, a difference of 1.7%.
8th Grade Correlation Summary
| Measurement | West Indian | Immigrants from Ecuador |
| Minimum | 89.4% | 81.2% |
| Maximum | 100.0% | 99.5% |
| Range | 10.6% | 18.3% |
| Mean | 95.8% | 91.9% |
| Median | 95.7% | 91.9% |
| Interquartile 25% (IQ1) | 94.9% | 90.1% |
| Interquartile 75% (IQ3) | 96.8% | 94.2% |
| Interquartile Range (IQR) | 1.9% | 4.1% |
| Standard Deviation (Sample) | 2.2% | 3.3% |
| Standard Deviation (Population) | 2.2% | 3.3% |
Similar Demographics by 8th Grade
Demographics Similar to West Indians by 8th Grade
In terms of 8th grade, the demographic groups most similar to West Indians are Immigrants from Ghana (94.8%, a difference of 0.010%), Immigrants from Uruguay (94.8%, a difference of 0.020%), Yuman (94.9%, a difference of 0.040%), Immigrants from Thailand (94.8%, a difference of 0.040%), and Immigrants from Hong Kong (94.9%, a difference of 0.050%).
| Demographics | Rating | Rank | 8th Grade |
| Ghanaians | 0.6 /100 | #259 | Tragic 94.9% |
| Immigrants | Jamaica | 0.6 /100 | #260 | Tragic 94.9% |
| Immigrants | Costa Rica | 0.5 /100 | #261 | Tragic 94.9% |
| Immigrants | Nigeria | 0.4 /100 | #262 | Tragic 94.9% |
| Immigrants | Hong Kong | 0.4 /100 | #263 | Tragic 94.9% |
| South Americans | 0.4 /100 | #264 | Tragic 94.9% |
| Yuman | 0.4 /100 | #265 | Tragic 94.9% |
| West Indians | 0.3 /100 | #266 | Tragic 94.8% |
| Immigrants | Ghana | 0.3 /100 | #267 | Tragic 94.8% |
| Immigrants | Uruguay | 0.3 /100 | #268 | Tragic 94.8% |
| Immigrants | Thailand | 0.2 /100 | #269 | Tragic 94.8% |
| Immigrants | Uzbekistan | 0.2 /100 | #270 | Tragic 94.8% |
| Immigrants | Afghanistan | 0.2 /100 | #271 | Tragic 94.8% |
| Immigrants | South America | 0.2 /100 | #272 | Tragic 94.8% |
| Immigrants | Western Africa | 0.2 /100 | #273 | Tragic 94.8% |
Demographics Similar to Immigrants from Ecuador by 8th Grade
In terms of 8th grade, the demographic groups most similar to Immigrants from Ecuador are Puerto Rican (93.2%, a difference of 0.010%), Immigrants from Cuba (93.2%, a difference of 0.040%), Immigrants from Cambodia (93.3%, a difference of 0.060%), Immigrants from Fiji (93.2%, a difference of 0.070%), and Belizean (93.1%, a difference of 0.20%).
| Demographics | Rating | Rank | 8th Grade |
| Japanese | 0.0 /100 | #310 | Tragic 93.6% |
| Immigrants | Bangladesh | 0.0 /100 | #311 | Tragic 93.6% |
| Cape Verdeans | 0.0 /100 | #312 | Tragic 93.5% |
| Immigrants | Caribbean | 0.0 /100 | #313 | Tragic 93.5% |
| Immigrants | Vietnam | 0.0 /100 | #314 | Tragic 93.5% |
| Vietnamese | 0.0 /100 | #315 | Tragic 93.5% |
| Immigrants | Cambodia | 0.0 /100 | #316 | Tragic 93.3% |
| Immigrants | Ecuador | 0.0 /100 | #317 | Tragic 93.3% |
| Puerto Ricans | 0.0 /100 | #318 | Tragic 93.2% |
| Immigrants | Cuba | 0.0 /100 | #319 | Tragic 93.2% |
| Immigrants | Fiji | 0.0 /100 | #320 | Tragic 93.2% |
| Belizeans | 0.0 /100 | #321 | Tragic 93.1% |
| Nicaraguans | 0.0 /100 | #322 | Tragic 93.0% |
| Immigrants | Belize | 0.0 /100 | #323 | Tragic 92.9% |
| Nepalese | 0.0 /100 | #324 | Tragic 92.8% |