Pima vs Immigrants from Ecuador 8th Grade
COMPARE
Pima
Immigrants from Ecuador
8th Grade
8th Grade Comparison
Pima
Immigrants from Ecuador
95.6%
8TH GRADE
28.6/ 100
METRIC RATING
192nd/ 347
METRIC RANK
93.3%
8TH GRADE
0.0/ 100
METRIC RATING
317th/ 347
METRIC RANK
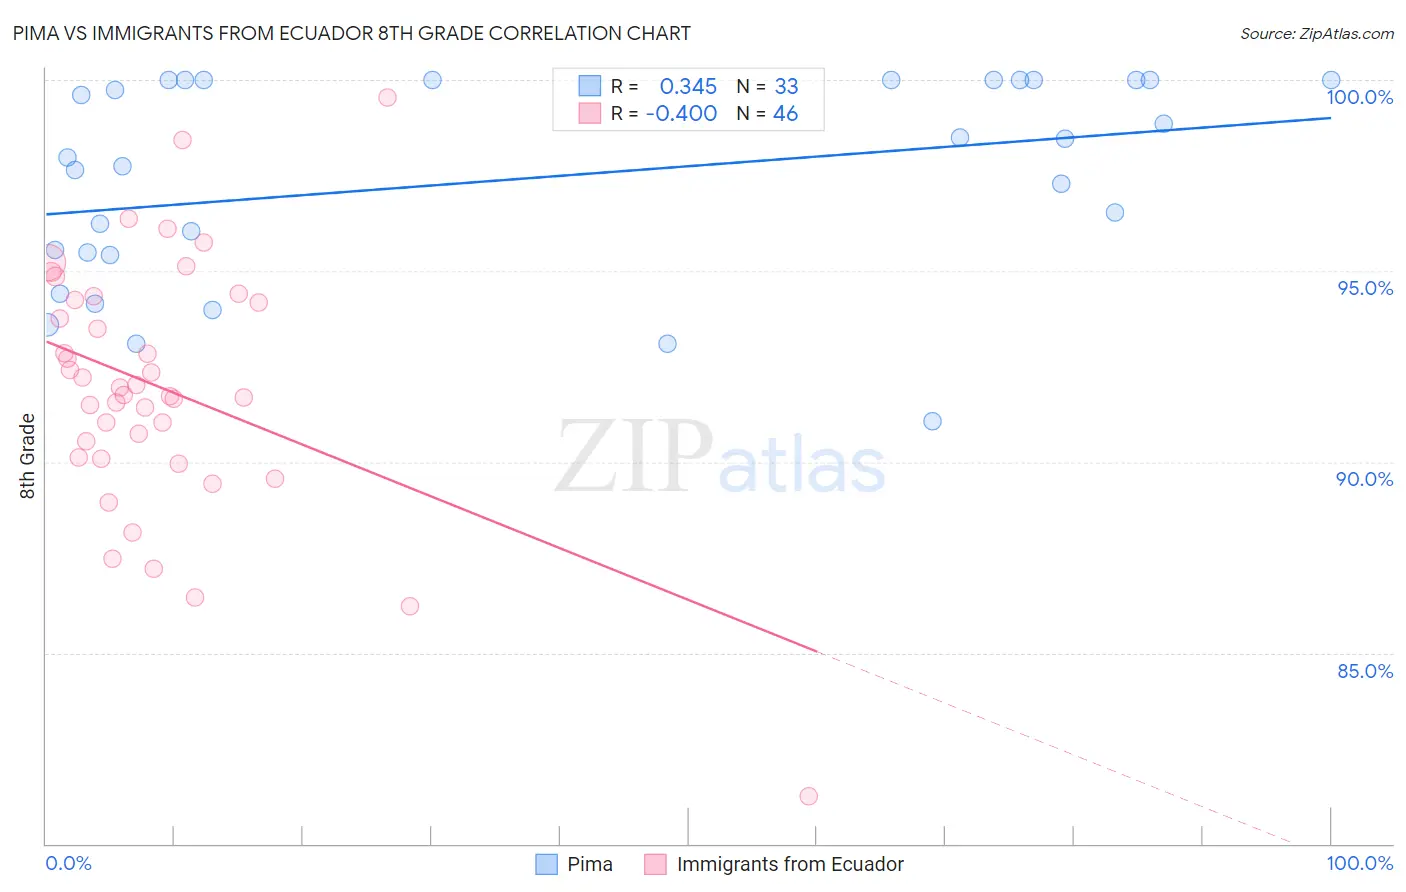
Pima vs Immigrants from Ecuador 8th Grade Correlation Chart
The statistical analysis conducted on geographies consisting of 61,552,136 people shows a mild positive correlation between the proportion of Pima and percentage of population with at least 8th grade education in the United States with a correlation coefficient (R) of 0.345 and weighted average of 95.6%. Similarly, the statistical analysis conducted on geographies consisting of 270,907,929 people shows a moderate negative correlation between the proportion of Immigrants from Ecuador and percentage of population with at least 8th grade education in the United States with a correlation coefficient (R) of -0.400 and weighted average of 93.3%, a difference of 2.5%.
8th Grade Correlation Summary
| Measurement | Pima | Immigrants from Ecuador |
| Minimum | 91.1% | 81.2% |
| Maximum | 100.0% | 99.5% |
| Range | 8.9% | 18.3% |
| Mean | 97.4% | 91.9% |
| Median | 98.0% | 91.9% |
| Interquartile 25% (IQ1) | 95.4% | 90.1% |
| Interquartile 75% (IQ3) | 100.0% | 94.2% |
| Interquartile Range (IQR) | 4.6% | 4.1% |
| Standard Deviation (Sample) | 2.7% | 3.3% |
| Standard Deviation (Population) | 2.6% | 3.3% |
Similar Demographics by 8th Grade
Demographics Similar to Pima by 8th Grade
In terms of 8th grade, the demographic groups most similar to Pima are Panamanian (95.6%, a difference of 0.0%), Immigrants from Nepal (95.6%, a difference of 0.010%), Immigrants from Micronesia (95.6%, a difference of 0.020%), Immigrants from Venezuela (95.6%, a difference of 0.020%), and Guamanian/Chamorro (95.6%, a difference of 0.020%).
| Demographics | Rating | Rank | 8th Grade |
| Blacks/African Americans | 34.8 /100 | #185 | Fair 95.6% |
| Brazilians | 34.8 /100 | #186 | Fair 95.6% |
| Sudanese | 33.0 /100 | #187 | Fair 95.6% |
| Liberians | 32.4 /100 | #188 | Fair 95.6% |
| Immigrants | Micronesia | 31.6 /100 | #189 | Fair 95.6% |
| Immigrants | Venezuela | 30.8 /100 | #190 | Fair 95.6% |
| Immigrants | Nepal | 30.2 /100 | #191 | Fair 95.6% |
| Pima | 28.6 /100 | #192 | Fair 95.6% |
| Panamanians | 28.4 /100 | #193 | Fair 95.6% |
| Guamanians/Chamorros | 26.6 /100 | #194 | Fair 95.6% |
| Immigrants | Zaire | 25.2 /100 | #195 | Fair 95.6% |
| Assyrians/Chaldeans/Syriacs | 24.5 /100 | #196 | Fair 95.6% |
| Sierra Leoneans | 24.3 /100 | #197 | Fair 95.6% |
| Paraguayans | 22.6 /100 | #198 | Fair 95.5% |
| Immigrants | Northern Africa | 22.5 /100 | #199 | Fair 95.5% |
Demographics Similar to Immigrants from Ecuador by 8th Grade
In terms of 8th grade, the demographic groups most similar to Immigrants from Ecuador are Puerto Rican (93.2%, a difference of 0.010%), Immigrants from Cuba (93.2%, a difference of 0.040%), Immigrants from Cambodia (93.3%, a difference of 0.060%), Immigrants from Fiji (93.2%, a difference of 0.070%), and Belizean (93.1%, a difference of 0.20%).
| Demographics | Rating | Rank | 8th Grade |
| Japanese | 0.0 /100 | #310 | Tragic 93.6% |
| Immigrants | Bangladesh | 0.0 /100 | #311 | Tragic 93.6% |
| Cape Verdeans | 0.0 /100 | #312 | Tragic 93.5% |
| Immigrants | Caribbean | 0.0 /100 | #313 | Tragic 93.5% |
| Immigrants | Vietnam | 0.0 /100 | #314 | Tragic 93.5% |
| Vietnamese | 0.0 /100 | #315 | Tragic 93.5% |
| Immigrants | Cambodia | 0.0 /100 | #316 | Tragic 93.3% |
| Immigrants | Ecuador | 0.0 /100 | #317 | Tragic 93.3% |
| Puerto Ricans | 0.0 /100 | #318 | Tragic 93.2% |
| Immigrants | Cuba | 0.0 /100 | #319 | Tragic 93.2% |
| Immigrants | Fiji | 0.0 /100 | #320 | Tragic 93.2% |
| Belizeans | 0.0 /100 | #321 | Tragic 93.1% |
| Nicaraguans | 0.0 /100 | #322 | Tragic 93.0% |
| Immigrants | Belize | 0.0 /100 | #323 | Tragic 92.9% |
| Nepalese | 0.0 /100 | #324 | Tragic 92.8% |