West Indian vs Korean 8th Grade
COMPARE
West Indian
Korean
8th Grade
8th Grade Comparison
West Indians
Koreans
94.8%
8TH GRADE
0.3/ 100
METRIC RATING
266th/ 347
METRIC RANK
95.0%
8TH GRADE
1.1/ 100
METRIC RATING
250th/ 347
METRIC RANK
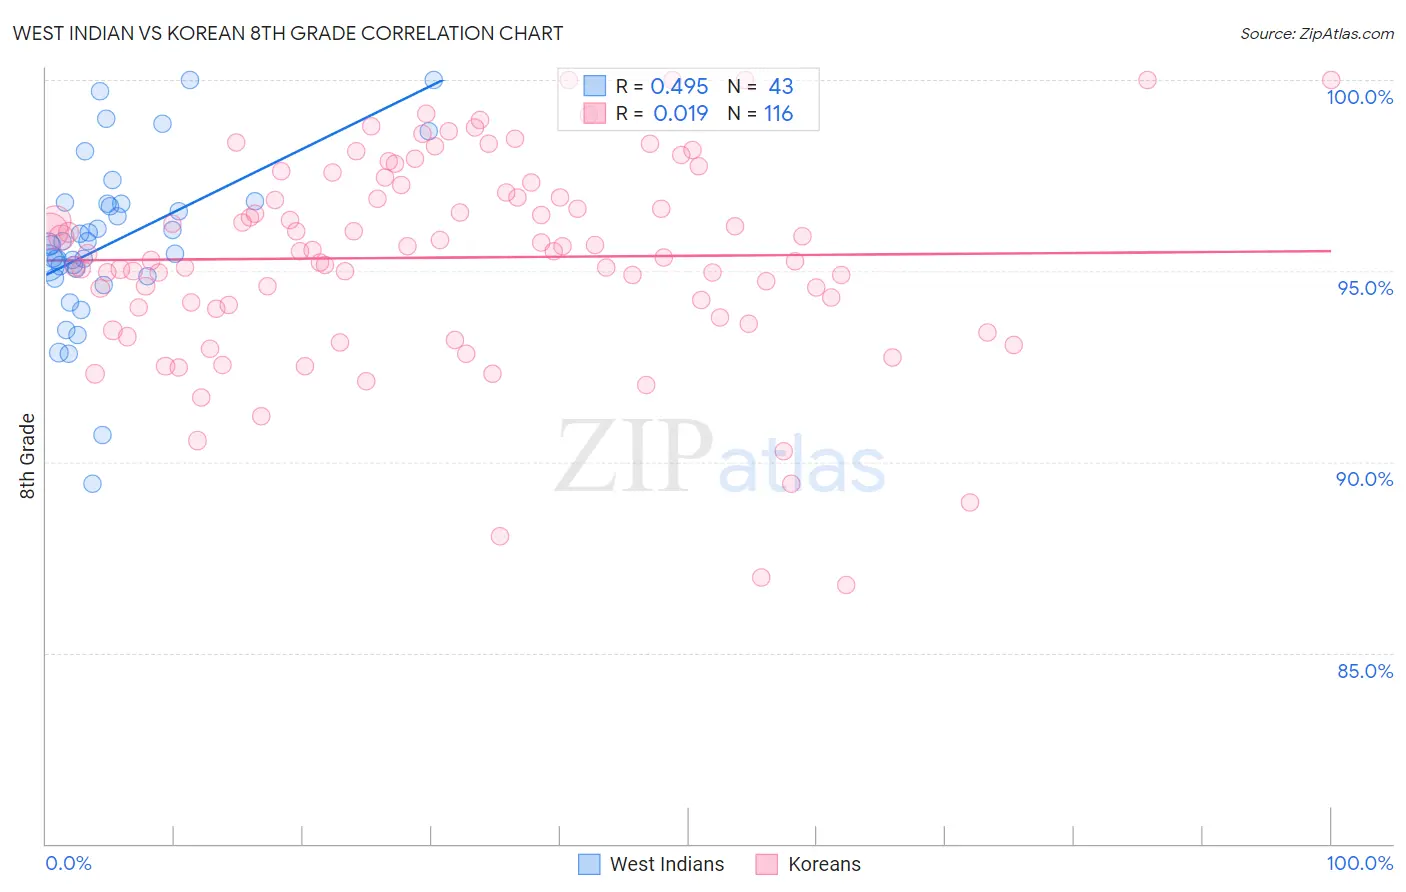
West Indian vs Korean 8th Grade Correlation Chart
The statistical analysis conducted on geographies consisting of 254,059,006 people shows a moderate positive correlation between the proportion of West Indians and percentage of population with at least 8th grade education in the United States with a correlation coefficient (R) of 0.495 and weighted average of 94.8%. Similarly, the statistical analysis conducted on geographies consisting of 510,944,198 people shows no correlation between the proportion of Koreans and percentage of population with at least 8th grade education in the United States with a correlation coefficient (R) of 0.019 and weighted average of 95.0%, a difference of 0.21%.
8th Grade Correlation Summary
| Measurement | West Indian | Korean |
| Minimum | 89.4% | 86.8% |
| Maximum | 100.0% | 100.0% |
| Range | 10.6% | 13.2% |
| Mean | 95.8% | 95.3% |
| Median | 95.7% | 95.5% |
| Interquartile 25% (IQ1) | 94.9% | 94.0% |
| Interquartile 75% (IQ3) | 96.8% | 97.1% |
| Interquartile Range (IQR) | 1.9% | 3.1% |
| Standard Deviation (Sample) | 2.2% | 2.7% |
| Standard Deviation (Population) | 2.2% | 2.7% |
Demographics Similar to West Indians and Koreans by 8th Grade
In terms of 8th grade, the demographic groups most similar to West Indians are Immigrants from Ghana (94.8%, a difference of 0.010%), Immigrants from Uruguay (94.8%, a difference of 0.020%), Yuman (94.9%, a difference of 0.040%), Immigrants from Hong Kong (94.9%, a difference of 0.050%), and South American (94.9%, a difference of 0.050%). Similarly, the demographic groups most similar to Koreans are Immigrants from China (95.0%, a difference of 0.0%), Bolivian (95.0%, a difference of 0.010%), Immigrants from Ethiopia (95.0%, a difference of 0.010%), Uruguayan (95.1%, a difference of 0.020%), and U.S. Virgin Islander (95.0%, a difference of 0.020%).
| Demographics | Rating | Rank | 8th Grade |
| Uruguayans | 1.2 /100 | #248 | Tragic 95.1% |
| Immigrants | China | 1.1 /100 | #249 | Tragic 95.0% |
| Koreans | 1.1 /100 | #250 | Tragic 95.0% |
| Bolivians | 1.0 /100 | #251 | Tragic 95.0% |
| Immigrants | Ethiopia | 1.0 /100 | #252 | Tragic 95.0% |
| U.S. Virgin Islanders | 0.9 /100 | #253 | Tragic 95.0% |
| Immigrants | Cameroon | 0.8 /100 | #254 | Tragic 95.0% |
| Immigrants | Somalia | 0.7 /100 | #255 | Tragic 95.0% |
| Colombians | 0.7 /100 | #256 | Tragic 95.0% |
| Afghans | 0.6 /100 | #257 | Tragic 94.9% |
| Immigrants | Congo | 0.6 /100 | #258 | Tragic 94.9% |
| Ghanaians | 0.6 /100 | #259 | Tragic 94.9% |
| Immigrants | Jamaica | 0.6 /100 | #260 | Tragic 94.9% |
| Immigrants | Costa Rica | 0.5 /100 | #261 | Tragic 94.9% |
| Immigrants | Nigeria | 0.4 /100 | #262 | Tragic 94.9% |
| Immigrants | Hong Kong | 0.4 /100 | #263 | Tragic 94.9% |
| South Americans | 0.4 /100 | #264 | Tragic 94.9% |
| Yuman | 0.4 /100 | #265 | Tragic 94.9% |
| West Indians | 0.3 /100 | #266 | Tragic 94.8% |
| Immigrants | Ghana | 0.3 /100 | #267 | Tragic 94.8% |
| Immigrants | Uruguay | 0.3 /100 | #268 | Tragic 94.8% |