Asian vs Immigrants from Ecuador 8th Grade
COMPARE
Asian
Immigrants from Ecuador
8th Grade
8th Grade Comparison
Asians
Immigrants from Ecuador
95.2%
8TH GRADE
3.5/ 100
METRIC RATING
231st/ 347
METRIC RANK
93.3%
8TH GRADE
0.0/ 100
METRIC RATING
317th/ 347
METRIC RANK
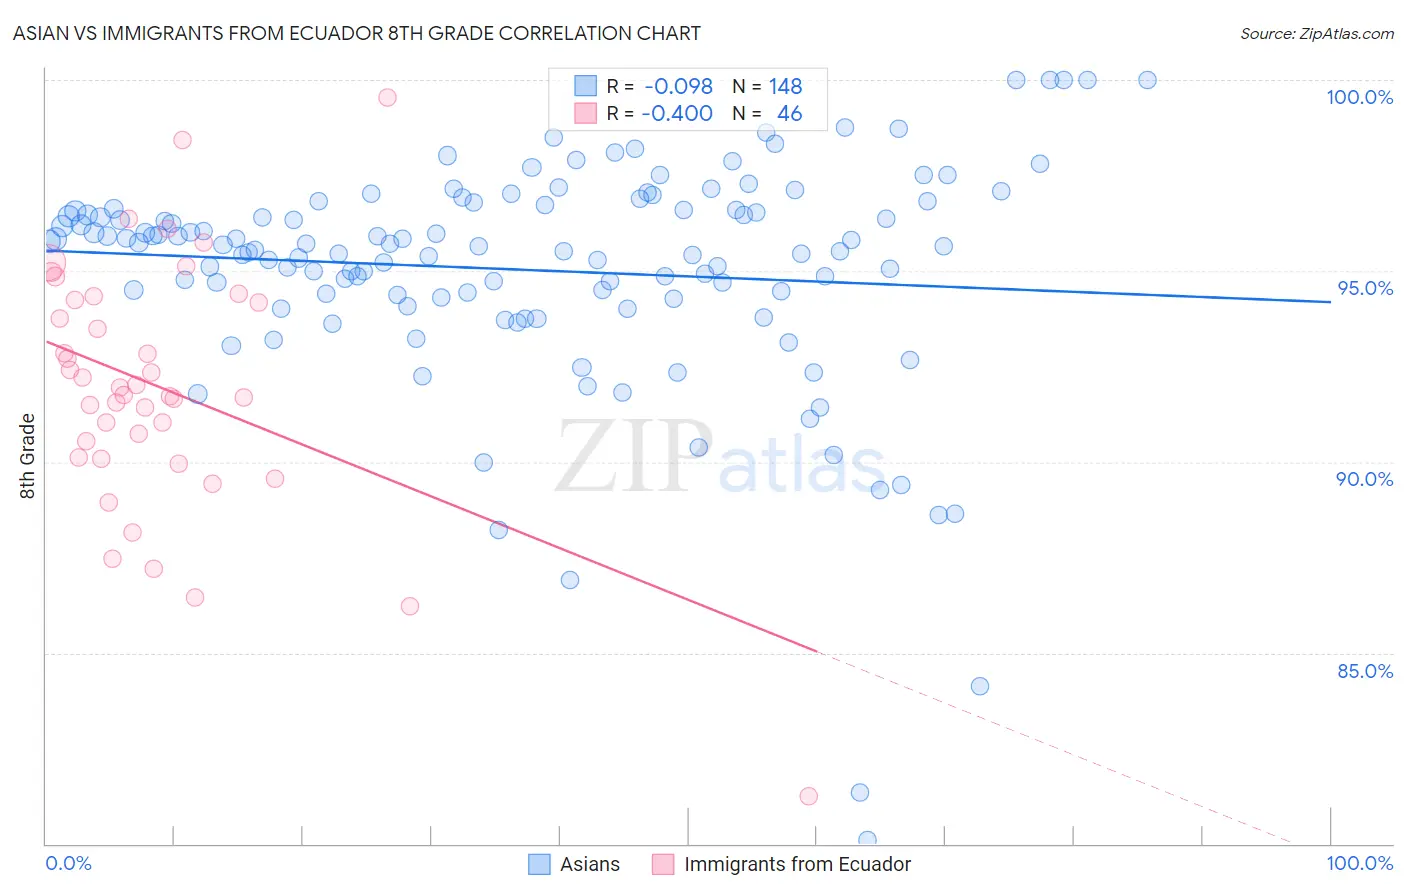
Asian vs Immigrants from Ecuador 8th Grade Correlation Chart
The statistical analysis conducted on geographies consisting of 550,917,032 people shows a slight negative correlation between the proportion of Asians and percentage of population with at least 8th grade education in the United States with a correlation coefficient (R) of -0.098 and weighted average of 95.2%. Similarly, the statistical analysis conducted on geographies consisting of 270,907,929 people shows a moderate negative correlation between the proportion of Immigrants from Ecuador and percentage of population with at least 8th grade education in the United States with a correlation coefficient (R) of -0.400 and weighted average of 93.3%, a difference of 2.1%.
8th Grade Correlation Summary
| Measurement | Asian | Immigrants from Ecuador |
| Minimum | 80.1% | 81.2% |
| Maximum | 100.0% | 99.5% |
| Range | 19.9% | 18.3% |
| Mean | 95.0% | 91.9% |
| Median | 95.6% | 91.9% |
| Interquartile 25% (IQ1) | 94.3% | 90.1% |
| Interquartile 75% (IQ3) | 96.6% | 94.2% |
| Interquartile Range (IQR) | 2.3% | 4.1% |
| Standard Deviation (Sample) | 3.0% | 3.3% |
| Standard Deviation (Population) | 3.0% | 3.3% |
Similar Demographics by 8th Grade
Demographics Similar to Asians by 8th Grade
In terms of 8th grade, the demographic groups most similar to Asians are Indian (Asian) (95.2%, a difference of 0.010%), Immigrants from Asia (95.2%, a difference of 0.020%), Costa Rican (95.2%, a difference of 0.020%), Immigrants from Panama (95.2%, a difference of 0.030%), and Nigerian (95.2%, a difference of 0.030%).
| Demographics | Rating | Rank | 8th Grade |
| Immigrants | Western Asia | 6.0 /100 | #224 | Tragic 95.3% |
| Sub-Saharan Africans | 6.0 /100 | #225 | Tragic 95.3% |
| Navajo | 5.7 /100 | #226 | Tragic 95.3% |
| Bahamians | 5.6 /100 | #227 | Tragic 95.3% |
| Immigrants | Eastern Africa | 5.6 /100 | #228 | Tragic 95.3% |
| Immigrants | Indonesia | 4.4 /100 | #229 | Tragic 95.3% |
| Immigrants | Panama | 4.1 /100 | #230 | Tragic 95.2% |
| Asians | 3.5 /100 | #231 | Tragic 95.2% |
| Indians (Asian) | 3.3 /100 | #232 | Tragic 95.2% |
| Immigrants | Asia | 3.1 /100 | #233 | Tragic 95.2% |
| Costa Ricans | 3.0 /100 | #234 | Tragic 95.2% |
| Nigerians | 2.9 /100 | #235 | Tragic 95.2% |
| Senegalese | 2.7 /100 | #236 | Tragic 95.2% |
| Immigrants | Africa | 2.7 /100 | #237 | Tragic 95.2% |
| Natives/Alaskans | 2.3 /100 | #238 | Tragic 95.2% |
Demographics Similar to Immigrants from Ecuador by 8th Grade
In terms of 8th grade, the demographic groups most similar to Immigrants from Ecuador are Puerto Rican (93.2%, a difference of 0.010%), Immigrants from Cuba (93.2%, a difference of 0.040%), Immigrants from Cambodia (93.3%, a difference of 0.060%), Immigrants from Fiji (93.2%, a difference of 0.070%), and Belizean (93.1%, a difference of 0.20%).
| Demographics | Rating | Rank | 8th Grade |
| Japanese | 0.0 /100 | #310 | Tragic 93.6% |
| Immigrants | Bangladesh | 0.0 /100 | #311 | Tragic 93.6% |
| Cape Verdeans | 0.0 /100 | #312 | Tragic 93.5% |
| Immigrants | Caribbean | 0.0 /100 | #313 | Tragic 93.5% |
| Immigrants | Vietnam | 0.0 /100 | #314 | Tragic 93.5% |
| Vietnamese | 0.0 /100 | #315 | Tragic 93.5% |
| Immigrants | Cambodia | 0.0 /100 | #316 | Tragic 93.3% |
| Immigrants | Ecuador | 0.0 /100 | #317 | Tragic 93.3% |
| Puerto Ricans | 0.0 /100 | #318 | Tragic 93.2% |
| Immigrants | Cuba | 0.0 /100 | #319 | Tragic 93.2% |
| Immigrants | Fiji | 0.0 /100 | #320 | Tragic 93.2% |
| Belizeans | 0.0 /100 | #321 | Tragic 93.1% |
| Nicaraguans | 0.0 /100 | #322 | Tragic 93.0% |
| Immigrants | Belize | 0.0 /100 | #323 | Tragic 92.9% |
| Nepalese | 0.0 /100 | #324 | Tragic 92.8% |