Iroquois vs Immigrants from Ecuador 8th Grade
COMPARE
Iroquois
Immigrants from Ecuador
8th Grade
8th Grade Comparison
Iroquois
Immigrants from Ecuador
96.3%
8TH GRADE
97.5/ 100
METRIC RATING
109th/ 347
METRIC RANK
93.3%
8TH GRADE
0.0/ 100
METRIC RATING
317th/ 347
METRIC RANK
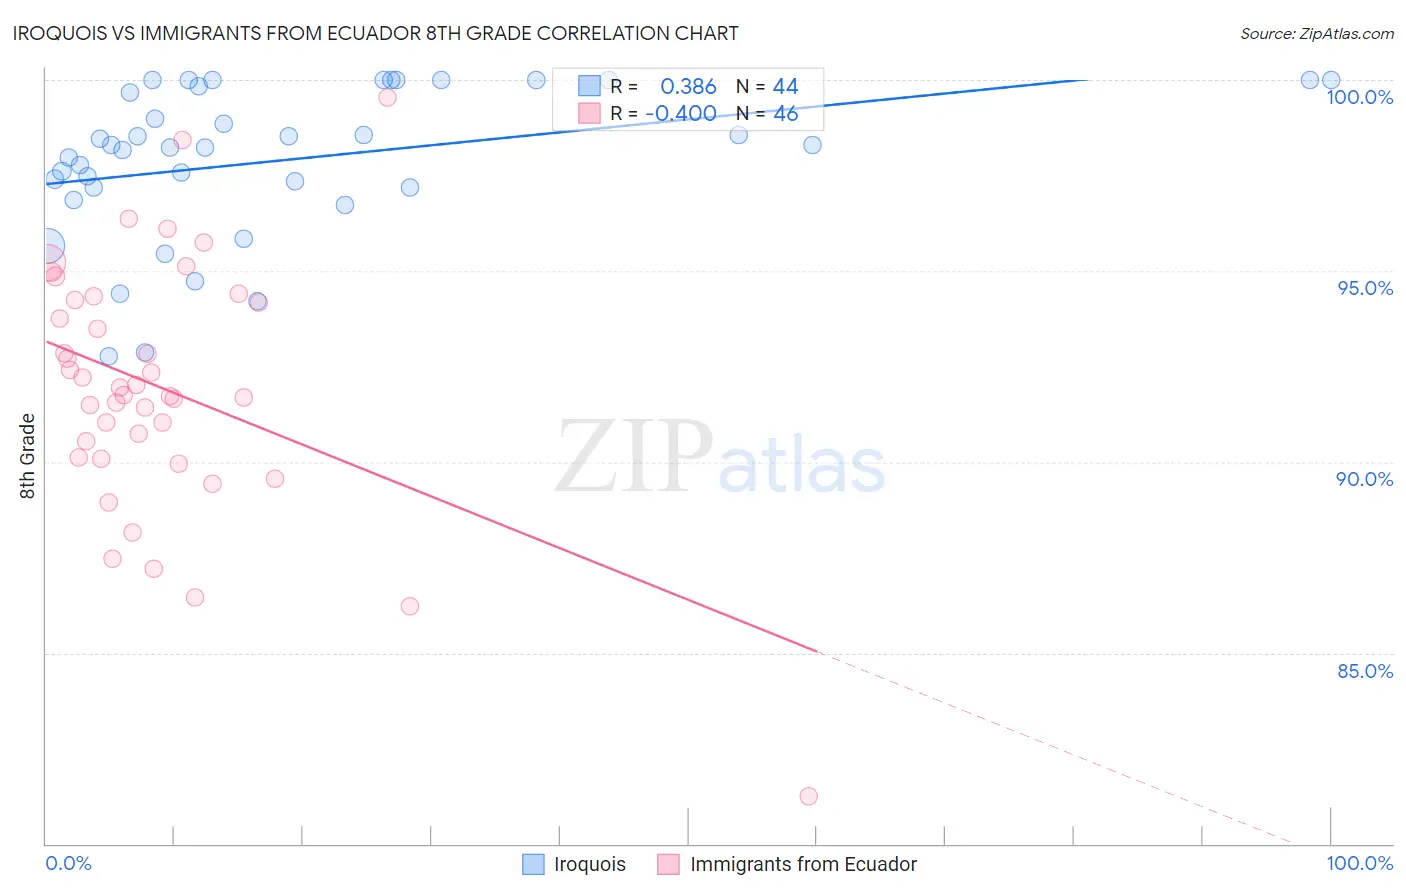
Iroquois vs Immigrants from Ecuador 8th Grade Correlation Chart
The statistical analysis conducted on geographies consisting of 207,308,056 people shows a mild positive correlation between the proportion of Iroquois and percentage of population with at least 8th grade education in the United States with a correlation coefficient (R) of 0.386 and weighted average of 96.3%. Similarly, the statistical analysis conducted on geographies consisting of 270,907,929 people shows a moderate negative correlation between the proportion of Immigrants from Ecuador and percentage of population with at least 8th grade education in the United States with a correlation coefficient (R) of -0.400 and weighted average of 93.3%, a difference of 3.3%.
8th Grade Correlation Summary
| Measurement | Iroquois | Immigrants from Ecuador |
| Minimum | 92.8% | 81.2% |
| Maximum | 100.0% | 99.5% |
| Range | 7.2% | 18.3% |
| Mean | 97.9% | 91.9% |
| Median | 98.3% | 91.9% |
| Interquartile 25% (IQ1) | 97.2% | 90.1% |
| Interquartile 75% (IQ3) | 99.9% | 94.2% |
| Interquartile Range (IQR) | 2.7% | 4.1% |
| Standard Deviation (Sample) | 2.0% | 3.3% |
| Standard Deviation (Population) | 2.0% | 3.3% |
Similar Demographics by 8th Grade
Demographics Similar to Iroquois by 8th Grade
In terms of 8th grade, the demographic groups most similar to Iroquois are Lebanese (96.3%, a difference of 0.0%), Immigrants from Latvia (96.3%, a difference of 0.020%), Cajun (96.3%, a difference of 0.020%), Okinawan (96.3%, a difference of 0.030%), and Immigrants from Saudi Arabia (96.3%, a difference of 0.040%).
| Demographics | Rating | Rank | 8th Grade |
| South Africans | 98.2 /100 | #102 | Exceptional 96.4% |
| Immigrants | Saudi Arabia | 98.0 /100 | #103 | Exceptional 96.3% |
| Kiowa | 98.0 /100 | #104 | Exceptional 96.3% |
| Immigrants | North Macedonia | 98.0 /100 | #105 | Exceptional 96.3% |
| Okinawans | 98.0 /100 | #106 | Exceptional 96.3% |
| Immigrants | Latvia | 97.8 /100 | #107 | Exceptional 96.3% |
| Lebanese | 97.5 /100 | #108 | Exceptional 96.3% |
| Iroquois | 97.5 /100 | #109 | Exceptional 96.3% |
| Cajuns | 97.1 /100 | #110 | Exceptional 96.3% |
| Shoshone | 96.8 /100 | #111 | Exceptional 96.3% |
| Syrians | 96.7 /100 | #112 | Exceptional 96.3% |
| Immigrants | Zimbabwe | 96.7 /100 | #113 | Exceptional 96.3% |
| Immigrants | Japan | 96.5 /100 | #114 | Exceptional 96.2% |
| Immigrants | Moldova | 96.5 /100 | #115 | Exceptional 96.2% |
| Immigrants | Nonimmigrants | 96.0 /100 | #116 | Exceptional 96.2% |
Demographics Similar to Immigrants from Ecuador by 8th Grade
In terms of 8th grade, the demographic groups most similar to Immigrants from Ecuador are Puerto Rican (93.2%, a difference of 0.010%), Immigrants from Cuba (93.2%, a difference of 0.040%), Immigrants from Cambodia (93.3%, a difference of 0.060%), Immigrants from Fiji (93.2%, a difference of 0.070%), and Belizean (93.1%, a difference of 0.20%).
| Demographics | Rating | Rank | 8th Grade |
| Japanese | 0.0 /100 | #310 | Tragic 93.6% |
| Immigrants | Bangladesh | 0.0 /100 | #311 | Tragic 93.6% |
| Cape Verdeans | 0.0 /100 | #312 | Tragic 93.5% |
| Immigrants | Caribbean | 0.0 /100 | #313 | Tragic 93.5% |
| Immigrants | Vietnam | 0.0 /100 | #314 | Tragic 93.5% |
| Vietnamese | 0.0 /100 | #315 | Tragic 93.5% |
| Immigrants | Cambodia | 0.0 /100 | #316 | Tragic 93.3% |
| Immigrants | Ecuador | 0.0 /100 | #317 | Tragic 93.3% |
| Puerto Ricans | 0.0 /100 | #318 | Tragic 93.2% |
| Immigrants | Cuba | 0.0 /100 | #319 | Tragic 93.2% |
| Immigrants | Fiji | 0.0 /100 | #320 | Tragic 93.2% |
| Belizeans | 0.0 /100 | #321 | Tragic 93.1% |
| Nicaraguans | 0.0 /100 | #322 | Tragic 93.0% |
| Immigrants | Belize | 0.0 /100 | #323 | Tragic 92.9% |
| Nepalese | 0.0 /100 | #324 | Tragic 92.8% |