Korean vs Immigrants from China 1st Grade
COMPARE
Korean
Immigrants from China
1st Grade
1st Grade Comparison
Koreans
Immigrants from China
97.6%
1ST GRADE
1.5/ 100
METRIC RATING
240th/ 347
METRIC RANK
97.4%
1ST GRADE
0.1/ 100
METRIC RATING
275th/ 347
METRIC RANK
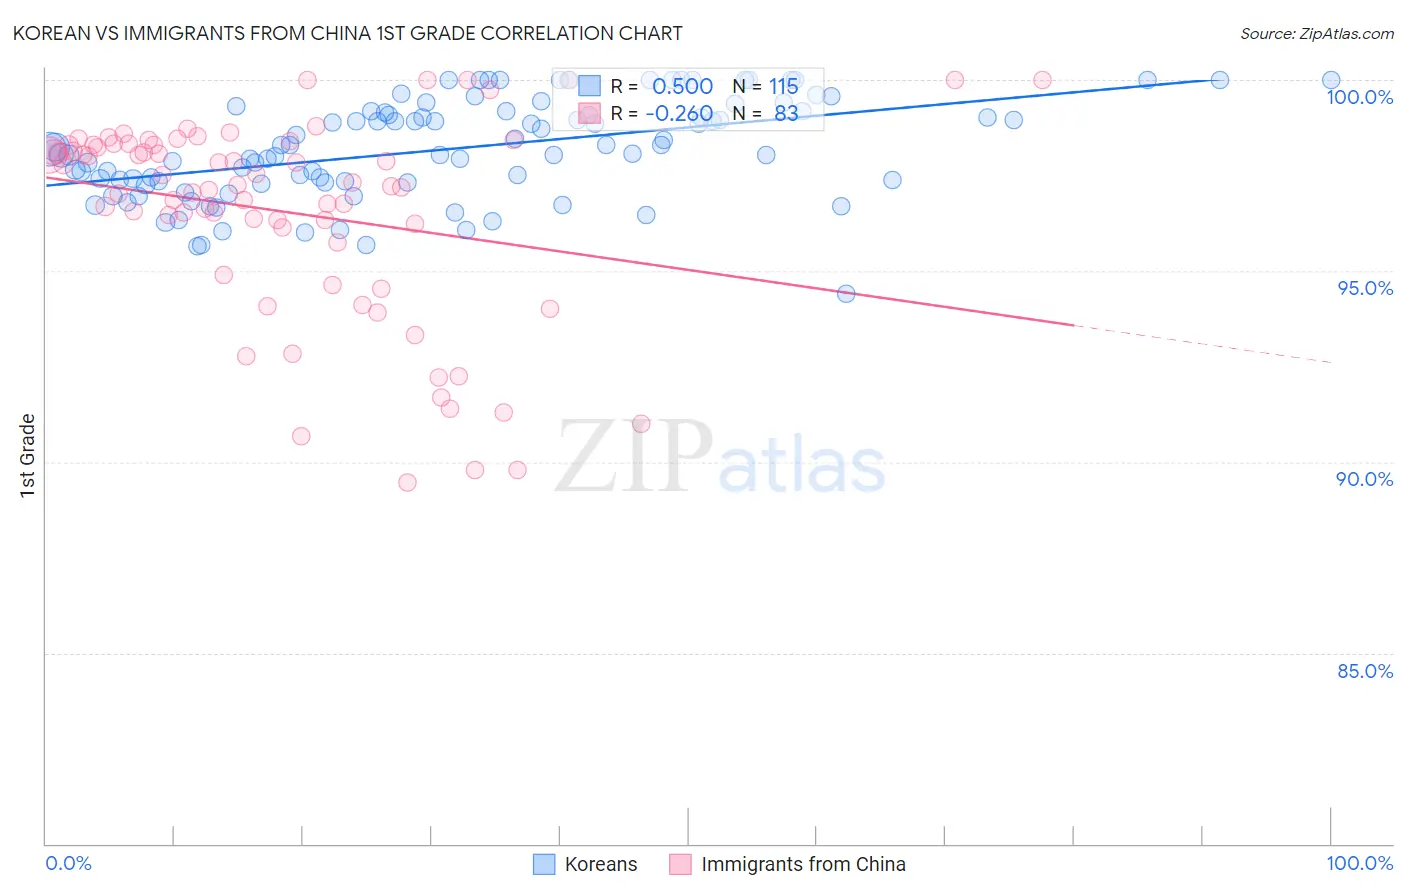
Korean vs Immigrants from China 1st Grade Correlation Chart
The statistical analysis conducted on geographies consisting of 510,939,860 people shows a substantial positive correlation between the proportion of Koreans and percentage of population with at least 1st grade education in the United States with a correlation coefficient (R) of 0.500 and weighted average of 97.6%. Similarly, the statistical analysis conducted on geographies consisting of 457,082,957 people shows a weak negative correlation between the proportion of Immigrants from China and percentage of population with at least 1st grade education in the United States with a correlation coefficient (R) of -0.260 and weighted average of 97.4%, a difference of 0.20%.
1st Grade Correlation Summary
| Measurement | Korean | Immigrants from China |
| Minimum | 94.4% | 89.5% |
| Maximum | 100.0% | 100.0% |
| Range | 5.6% | 10.5% |
| Mean | 98.2% | 96.5% |
| Median | 98.2% | 97.3% |
| Interquartile 25% (IQ1) | 97.3% | 95.7% |
| Interquartile 75% (IQ3) | 99.2% | 98.3% |
| Interquartile Range (IQR) | 1.9% | 2.6% |
| Standard Deviation (Sample) | 1.3% | 2.6% |
| Standard Deviation (Population) | 1.3% | 2.6% |
Similar Demographics by 1st Grade
Demographics Similar to Koreans by 1st Grade
In terms of 1st grade, the demographic groups most similar to Koreans are Immigrants from Eastern Asia (97.6%, a difference of 0.0%), Liberian (97.6%, a difference of 0.0%), Nigerian (97.6%, a difference of 0.010%), U.S. Virgin Islander (97.6%, a difference of 0.020%), and Immigrants from Indonesia (97.6%, a difference of 0.020%).
| Demographics | Rating | Rank | 1st Grade |
| Immigrants | Pakistan | 2.2 /100 | #233 | Tragic 97.6% |
| Colombians | 2.2 /100 | #234 | Tragic 97.6% |
| Immigrants | Malaysia | 2.1 /100 | #235 | Tragic 97.6% |
| Immigrants | Western Asia | 2.1 /100 | #236 | Tragic 97.6% |
| U.S. Virgin Islanders | 1.9 /100 | #237 | Tragic 97.6% |
| Nigerians | 1.8 /100 | #238 | Tragic 97.6% |
| Immigrants | Eastern Asia | 1.6 /100 | #239 | Tragic 97.6% |
| Koreans | 1.5 /100 | #240 | Tragic 97.6% |
| Liberians | 1.4 /100 | #241 | Tragic 97.6% |
| Immigrants | Indonesia | 1.2 /100 | #242 | Tragic 97.6% |
| Bolivians | 1.2 /100 | #243 | Tragic 97.6% |
| Asians | 1.1 /100 | #244 | Tragic 97.6% |
| South Americans | 1.1 /100 | #245 | Tragic 97.6% |
| Immigrants | Eastern Africa | 1.0 /100 | #246 | Tragic 97.6% |
| Peruvians | 1.0 /100 | #247 | Tragic 97.6% |
Demographics Similar to Immigrants from China by 1st Grade
In terms of 1st grade, the demographic groups most similar to Immigrants from China are Ghanaian (97.4%, a difference of 0.0%), Immigrants from Philippines (97.4%, a difference of 0.020%), Immigrants from Western Africa (97.4%, a difference of 0.020%), Immigrants from Bolivia (97.4%, a difference of 0.030%), and Immigrants from Cameroon (97.4%, a difference of 0.040%).
| Demographics | Rating | Rank | 1st Grade |
| Immigrants | Nigeria | 0.3 /100 | #268 | Tragic 97.5% |
| West Indians | 0.3 /100 | #269 | Tragic 97.5% |
| Immigrants | Jamaica | 0.2 /100 | #270 | Tragic 97.5% |
| Immigrants | Cameroon | 0.2 /100 | #271 | Tragic 97.4% |
| Immigrants | Peru | 0.2 /100 | #272 | Tragic 97.4% |
| Immigrants | Bolivia | 0.2 /100 | #273 | Tragic 97.4% |
| Ghanaians | 0.1 /100 | #274 | Tragic 97.4% |
| Immigrants | China | 0.1 /100 | #275 | Tragic 97.4% |
| Immigrants | Philippines | 0.1 /100 | #276 | Tragic 97.4% |
| Immigrants | Western Africa | 0.1 /100 | #277 | Tragic 97.4% |
| Immigrants | Uzbekistan | 0.1 /100 | #278 | Tragic 97.4% |
| Immigrants | Ghana | 0.1 /100 | #279 | Tragic 97.4% |
| Afghans | 0.1 /100 | #280 | Tragic 97.4% |
| Trinidadians and Tobagonians | 0.1 /100 | #281 | Tragic 97.3% |
| Barbadians | 0.1 /100 | #282 | Tragic 97.3% |