Immigrants from Moldova vs Immigrants from China 1st Grade
COMPARE
Immigrants from Moldova
Immigrants from China
1st Grade
1st Grade Comparison
Immigrants from Moldova
Immigrants from China
98.0%
1ST GRADE
69.5/ 100
METRIC RATING
152nd/ 347
METRIC RANK
97.4%
1ST GRADE
0.1/ 100
METRIC RATING
275th/ 347
METRIC RANK
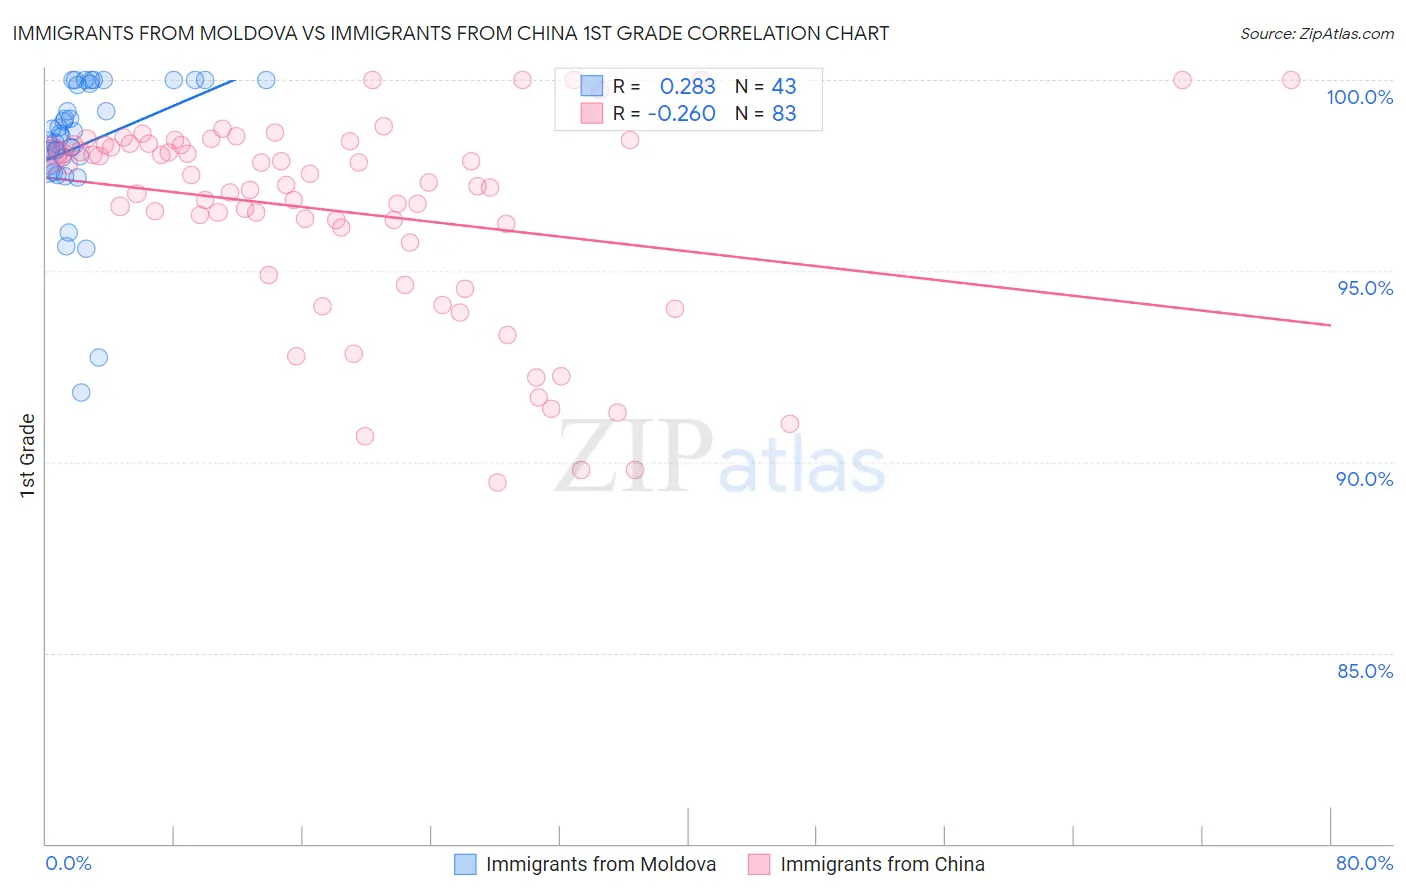
Immigrants from Moldova vs Immigrants from China 1st Grade Correlation Chart
The statistical analysis conducted on geographies consisting of 124,398,501 people shows a weak positive correlation between the proportion of Immigrants from Moldova and percentage of population with at least 1st grade education in the United States with a correlation coefficient (R) of 0.283 and weighted average of 98.0%. Similarly, the statistical analysis conducted on geographies consisting of 457,082,957 people shows a weak negative correlation between the proportion of Immigrants from China and percentage of population with at least 1st grade education in the United States with a correlation coefficient (R) of -0.260 and weighted average of 97.4%, a difference of 0.59%.
1st Grade Correlation Summary
| Measurement | Immigrants from Moldova | Immigrants from China |
| Minimum | 91.8% | 89.5% |
| Maximum | 100.0% | 100.0% |
| Range | 8.2% | 10.5% |
| Mean | 98.3% | 96.5% |
| Median | 98.5% | 97.3% |
| Interquartile 25% (IQ1) | 97.7% | 95.7% |
| Interquartile 75% (IQ3) | 99.9% | 98.3% |
| Interquartile Range (IQR) | 2.2% | 2.6% |
| Standard Deviation (Sample) | 1.8% | 2.6% |
| Standard Deviation (Population) | 1.8% | 2.6% |
Similar Demographics by 1st Grade
Demographics Similar to Immigrants from Moldova by 1st Grade
In terms of 1st grade, the demographic groups most similar to Immigrants from Moldova are Dutch West Indian (98.0%, a difference of 0.0%), Soviet Union (98.0%, a difference of 0.0%), Jordanian (98.0%, a difference of 0.010%), Immigrants from Iran (98.0%, a difference of 0.010%), and Comanche (98.0%, a difference of 0.010%).
| Demographics | Rating | Rank | 1st Grade |
| Hmong | 79.0 /100 | #145 | Good 98.0% |
| Immigrants | Israel | 77.8 /100 | #146 | Good 98.0% |
| Filipinos | 77.6 /100 | #147 | Good 98.0% |
| Apache | 75.2 /100 | #148 | Good 98.0% |
| Immigrants | Greece | 74.9 /100 | #149 | Good 98.0% |
| Jordanians | 72.7 /100 | #150 | Good 98.0% |
| Dutch West Indians | 69.8 /100 | #151 | Good 98.0% |
| Immigrants | Moldova | 69.5 /100 | #152 | Good 98.0% |
| Soviet Union | 68.9 /100 | #153 | Good 98.0% |
| Immigrants | Iran | 66.9 /100 | #154 | Good 98.0% |
| Comanche | 66.9 /100 | #155 | Good 98.0% |
| Immigrants | South Central Asia | 66.2 /100 | #156 | Good 98.0% |
| Immigrants | North Macedonia | 65.3 /100 | #157 | Good 98.0% |
| Venezuelans | 64.7 /100 | #158 | Good 98.0% |
| French American Indians | 63.7 /100 | #159 | Good 98.0% |
Demographics Similar to Immigrants from China by 1st Grade
In terms of 1st grade, the demographic groups most similar to Immigrants from China are Ghanaian (97.4%, a difference of 0.0%), Immigrants from Philippines (97.4%, a difference of 0.020%), Immigrants from Western Africa (97.4%, a difference of 0.020%), Immigrants from Bolivia (97.4%, a difference of 0.030%), and Immigrants from Cameroon (97.4%, a difference of 0.040%).
| Demographics | Rating | Rank | 1st Grade |
| Immigrants | Nigeria | 0.3 /100 | #268 | Tragic 97.5% |
| West Indians | 0.3 /100 | #269 | Tragic 97.5% |
| Immigrants | Jamaica | 0.2 /100 | #270 | Tragic 97.5% |
| Immigrants | Cameroon | 0.2 /100 | #271 | Tragic 97.4% |
| Immigrants | Peru | 0.2 /100 | #272 | Tragic 97.4% |
| Immigrants | Bolivia | 0.2 /100 | #273 | Tragic 97.4% |
| Ghanaians | 0.1 /100 | #274 | Tragic 97.4% |
| Immigrants | China | 0.1 /100 | #275 | Tragic 97.4% |
| Immigrants | Philippines | 0.1 /100 | #276 | Tragic 97.4% |
| Immigrants | Western Africa | 0.1 /100 | #277 | Tragic 97.4% |
| Immigrants | Uzbekistan | 0.1 /100 | #278 | Tragic 97.4% |
| Immigrants | Ghana | 0.1 /100 | #279 | Tragic 97.4% |
| Afghans | 0.1 /100 | #280 | Tragic 97.4% |
| Trinidadians and Tobagonians | 0.1 /100 | #281 | Tragic 97.3% |
| Barbadians | 0.1 /100 | #282 | Tragic 97.3% |