West Indian vs Immigrants from Kazakhstan 1st Grade
COMPARE
West Indian
Immigrants from Kazakhstan
1st Grade
1st Grade Comparison
West Indians
Immigrants from Kazakhstan
97.5%
1ST GRADE
0.3/ 100
METRIC RATING
269th/ 347
METRIC RANK
97.9%
1ST GRADE
34.9/ 100
METRIC RATING
189th/ 347
METRIC RANK
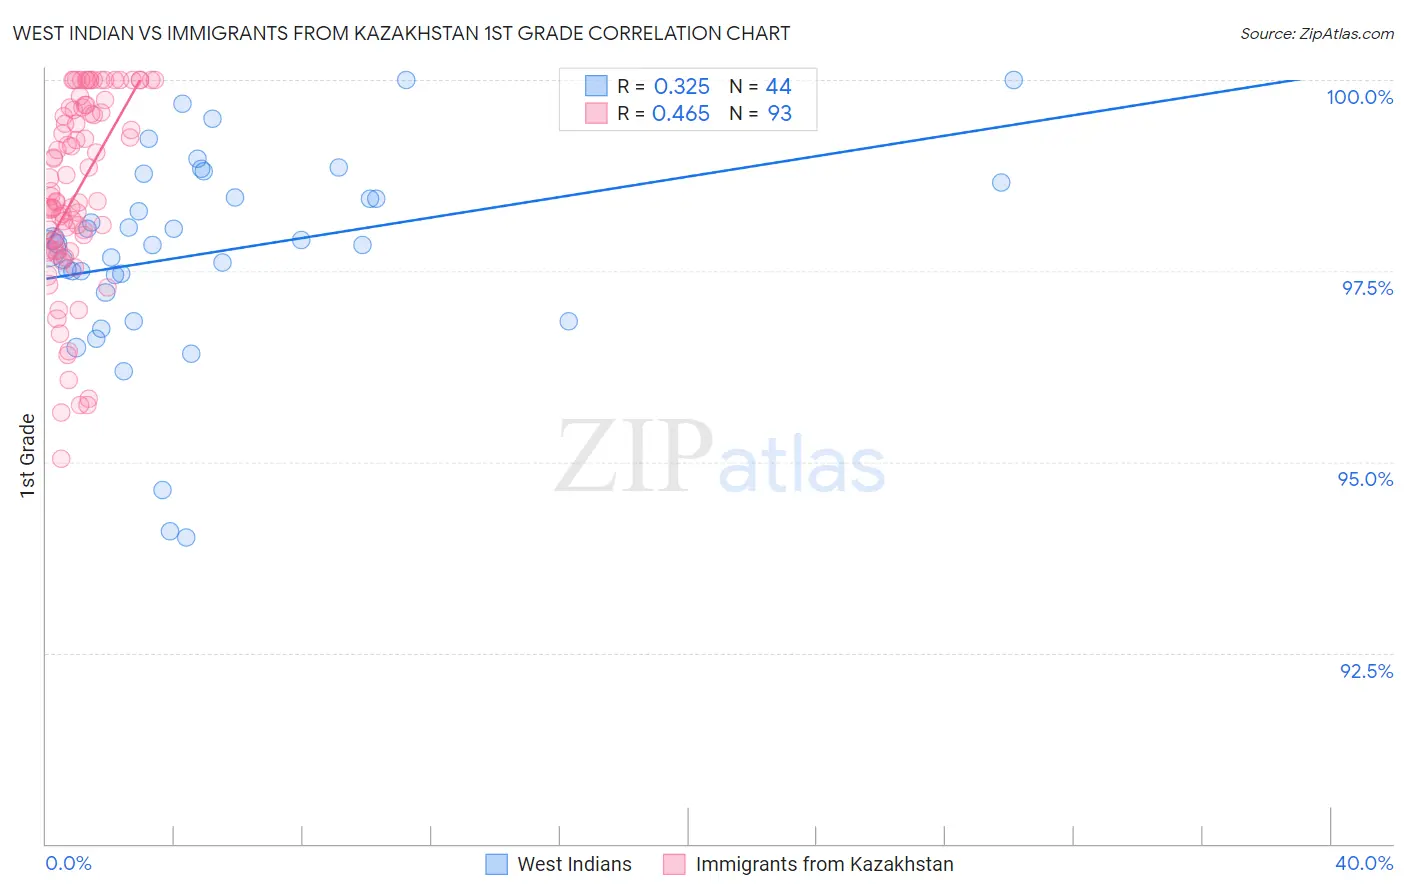
West Indian vs Immigrants from Kazakhstan 1st Grade Correlation Chart
The statistical analysis conducted on geographies consisting of 254,063,654 people shows a mild positive correlation between the proportion of West Indians and percentage of population with at least 1st grade education in the United States with a correlation coefficient (R) of 0.325 and weighted average of 97.5%. Similarly, the statistical analysis conducted on geographies consisting of 124,444,388 people shows a moderate positive correlation between the proportion of Immigrants from Kazakhstan and percentage of population with at least 1st grade education in the United States with a correlation coefficient (R) of 0.465 and weighted average of 97.9%, a difference of 0.41%.
1st Grade Correlation Summary
| Measurement | West Indian | Immigrants from Kazakhstan |
| Minimum | 94.0% | 95.0% |
| Maximum | 100.0% | 100.0% |
| Range | 6.0% | 5.0% |
| Mean | 97.7% | 98.6% |
| Median | 97.9% | 98.5% |
| Interquartile 25% (IQ1) | 97.3% | 97.8% |
| Interquartile 75% (IQ3) | 98.6% | 99.6% |
| Interquartile Range (IQR) | 1.2% | 1.9% |
| Standard Deviation (Sample) | 1.3% | 1.2% |
| Standard Deviation (Population) | 1.3% | 1.2% |
Similar Demographics by 1st Grade
Demographics Similar to West Indians by 1st Grade
In terms of 1st grade, the demographic groups most similar to West Indians are Immigrants from Sierra Leone (97.5%, a difference of 0.010%), Immigrants from Nigeria (97.5%, a difference of 0.010%), Cuban (97.5%, a difference of 0.020%), Immigrants from Liberia (97.5%, a difference of 0.020%), and Immigrants from Jamaica (97.5%, a difference of 0.020%).
| Demographics | Rating | Rank | 1st Grade |
| Assyrians/Chaldeans/Syriacs | 0.4 /100 | #262 | Tragic 97.5% |
| Immigrants | South America | 0.4 /100 | #263 | Tragic 97.5% |
| Taiwanese | 0.4 /100 | #264 | Tragic 97.5% |
| Cubans | 0.3 /100 | #265 | Tragic 97.5% |
| Immigrants | Liberia | 0.3 /100 | #266 | Tragic 97.5% |
| Immigrants | Sierra Leone | 0.3 /100 | #267 | Tragic 97.5% |
| Immigrants | Nigeria | 0.3 /100 | #268 | Tragic 97.5% |
| West Indians | 0.3 /100 | #269 | Tragic 97.5% |
| Immigrants | Jamaica | 0.2 /100 | #270 | Tragic 97.5% |
| Immigrants | Cameroon | 0.2 /100 | #271 | Tragic 97.4% |
| Immigrants | Peru | 0.2 /100 | #272 | Tragic 97.4% |
| Immigrants | Bolivia | 0.2 /100 | #273 | Tragic 97.4% |
| Ghanaians | 0.1 /100 | #274 | Tragic 97.4% |
| Immigrants | China | 0.1 /100 | #275 | Tragic 97.4% |
| Immigrants | Philippines | 0.1 /100 | #276 | Tragic 97.4% |
Demographics Similar to Immigrants from Kazakhstan by 1st Grade
In terms of 1st grade, the demographic groups most similar to Immigrants from Kazakhstan are Pakistani (97.9%, a difference of 0.0%), Arab (97.9%, a difference of 0.0%), Panamanian (97.9%, a difference of 0.0%), Immigrants from Belarus (97.9%, a difference of 0.010%), and Paiute (97.9%, a difference of 0.010%).
| Demographics | Rating | Rank | 1st Grade |
| Egyptians | 42.7 /100 | #182 | Average 97.9% |
| Immigrants | Argentina | 41.3 /100 | #183 | Average 97.9% |
| Immigrants | Poland | 40.1 /100 | #184 | Average 97.9% |
| Immigrants | Belarus | 39.3 /100 | #185 | Fair 97.9% |
| Paiute | 36.5 /100 | #186 | Fair 97.9% |
| Pakistanis | 35.8 /100 | #187 | Fair 97.9% |
| Arabs | 35.5 /100 | #188 | Fair 97.9% |
| Immigrants | Kazakhstan | 34.9 /100 | #189 | Fair 97.9% |
| Panamanians | 34.1 /100 | #190 | Fair 97.9% |
| Blacks/African Americans | 30.7 /100 | #191 | Fair 97.9% |
| Paraguayans | 30.2 /100 | #192 | Fair 97.9% |
| Immigrants | Taiwan | 29.4 /100 | #193 | Fair 97.9% |
| Mongolians | 29.2 /100 | #194 | Fair 97.9% |
| Hawaiians | 28.8 /100 | #195 | Fair 97.9% |
| Immigrants | Kenya | 26.3 /100 | #196 | Fair 97.8% |