Immigrants from Bangladesh vs Immigrants from China 1st Grade
COMPARE
Immigrants from Bangladesh
Immigrants from China
1st Grade
1st Grade Comparison
Immigrants from Bangladesh
Immigrants from China
96.8%
1ST GRADE
0.0/ 100
METRIC RATING
321st/ 347
METRIC RANK
97.4%
1ST GRADE
0.1/ 100
METRIC RATING
275th/ 347
METRIC RANK
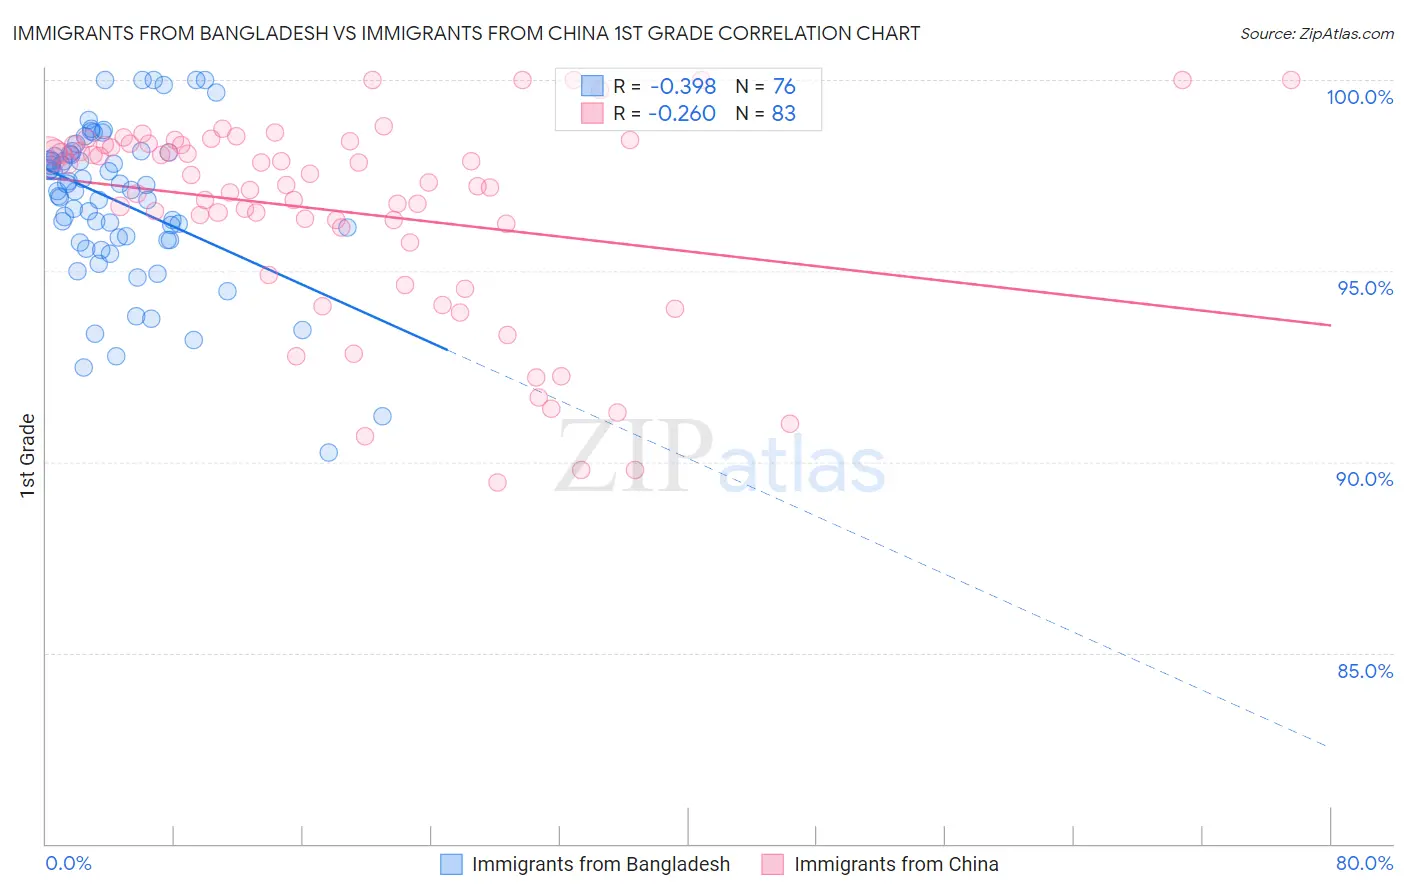
Immigrants from Bangladesh vs Immigrants from China 1st Grade Correlation Chart
The statistical analysis conducted on geographies consisting of 203,681,254 people shows a mild negative correlation between the proportion of Immigrants from Bangladesh and percentage of population with at least 1st grade education in the United States with a correlation coefficient (R) of -0.398 and weighted average of 96.8%. Similarly, the statistical analysis conducted on geographies consisting of 457,082,957 people shows a weak negative correlation between the proportion of Immigrants from China and percentage of population with at least 1st grade education in the United States with a correlation coefficient (R) of -0.260 and weighted average of 97.4%, a difference of 0.64%.
1st Grade Correlation Summary
| Measurement | Immigrants from Bangladesh | Immigrants from China |
| Minimum | 90.2% | 89.5% |
| Maximum | 100.0% | 100.0% |
| Range | 9.8% | 10.5% |
| Mean | 96.8% | 96.5% |
| Median | 97.1% | 97.3% |
| Interquartile 25% (IQ1) | 95.8% | 95.7% |
| Interquartile 75% (IQ3) | 98.0% | 98.3% |
| Interquartile Range (IQR) | 2.2% | 2.6% |
| Standard Deviation (Sample) | 2.0% | 2.6% |
| Standard Deviation (Population) | 2.0% | 2.6% |
Similar Demographics by 1st Grade
Demographics Similar to Immigrants from Bangladesh by 1st Grade
In terms of 1st grade, the demographic groups most similar to Immigrants from Bangladesh are Immigrants from Guyana (96.8%, a difference of 0.010%), Immigrants from Burma/Myanmar (96.8%, a difference of 0.010%), Immigrants from Laos (96.8%, a difference of 0.020%), Mexican American Indian (96.8%, a difference of 0.020%), and Immigrants from Honduras (96.8%, a difference of 0.020%).
| Demographics | Rating | Rank | 1st Grade |
| Hondurans | 0.0 /100 | #314 | Tragic 96.9% |
| Immigrants | Belize | 0.0 /100 | #315 | Tragic 96.9% |
| Immigrants | Ecuador | 0.0 /100 | #316 | Tragic 96.9% |
| Immigrants | Nicaragua | 0.0 /100 | #317 | Tragic 96.9% |
| Immigrants | Laos | 0.0 /100 | #318 | Tragic 96.8% |
| Immigrants | Guyana | 0.0 /100 | #319 | Tragic 96.8% |
| Immigrants | Burma/Myanmar | 0.0 /100 | #320 | Tragic 96.8% |
| Immigrants | Bangladesh | 0.0 /100 | #321 | Tragic 96.8% |
| Mexican American Indians | 0.0 /100 | #322 | Tragic 96.8% |
| Immigrants | Honduras | 0.0 /100 | #323 | Tragic 96.8% |
| Vietnamese | 0.0 /100 | #324 | Tragic 96.8% |
| Dominicans | 0.0 /100 | #325 | Tragic 96.7% |
| Indonesians | 0.0 /100 | #326 | Tragic 96.7% |
| Mexicans | 0.0 /100 | #327 | Tragic 96.7% |
| Immigrants | Latin America | 0.0 /100 | #328 | Tragic 96.7% |
Demographics Similar to Immigrants from China by 1st Grade
In terms of 1st grade, the demographic groups most similar to Immigrants from China are Ghanaian (97.4%, a difference of 0.0%), Immigrants from Philippines (97.4%, a difference of 0.020%), Immigrants from Western Africa (97.4%, a difference of 0.020%), Immigrants from Bolivia (97.4%, a difference of 0.030%), and Immigrants from Cameroon (97.4%, a difference of 0.040%).
| Demographics | Rating | Rank | 1st Grade |
| Immigrants | Nigeria | 0.3 /100 | #268 | Tragic 97.5% |
| West Indians | 0.3 /100 | #269 | Tragic 97.5% |
| Immigrants | Jamaica | 0.2 /100 | #270 | Tragic 97.5% |
| Immigrants | Cameroon | 0.2 /100 | #271 | Tragic 97.4% |
| Immigrants | Peru | 0.2 /100 | #272 | Tragic 97.4% |
| Immigrants | Bolivia | 0.2 /100 | #273 | Tragic 97.4% |
| Ghanaians | 0.1 /100 | #274 | Tragic 97.4% |
| Immigrants | China | 0.1 /100 | #275 | Tragic 97.4% |
| Immigrants | Philippines | 0.1 /100 | #276 | Tragic 97.4% |
| Immigrants | Western Africa | 0.1 /100 | #277 | Tragic 97.4% |
| Immigrants | Uzbekistan | 0.1 /100 | #278 | Tragic 97.4% |
| Immigrants | Ghana | 0.1 /100 | #279 | Tragic 97.4% |
| Afghans | 0.1 /100 | #280 | Tragic 97.4% |
| Trinidadians and Tobagonians | 0.1 /100 | #281 | Tragic 97.3% |
| Barbadians | 0.1 /100 | #282 | Tragic 97.3% |