Welsh vs Mexican 8th Grade
COMPARE
Welsh
Mexican
8th Grade
8th Grade Comparison
Welsh
Mexicans
97.2%
8TH GRADE
100.0/ 100
METRIC RATING
22nd/ 347
METRIC RANK
91.4%
8TH GRADE
0.0/ 100
METRIC RATING
339th/ 347
METRIC RANK
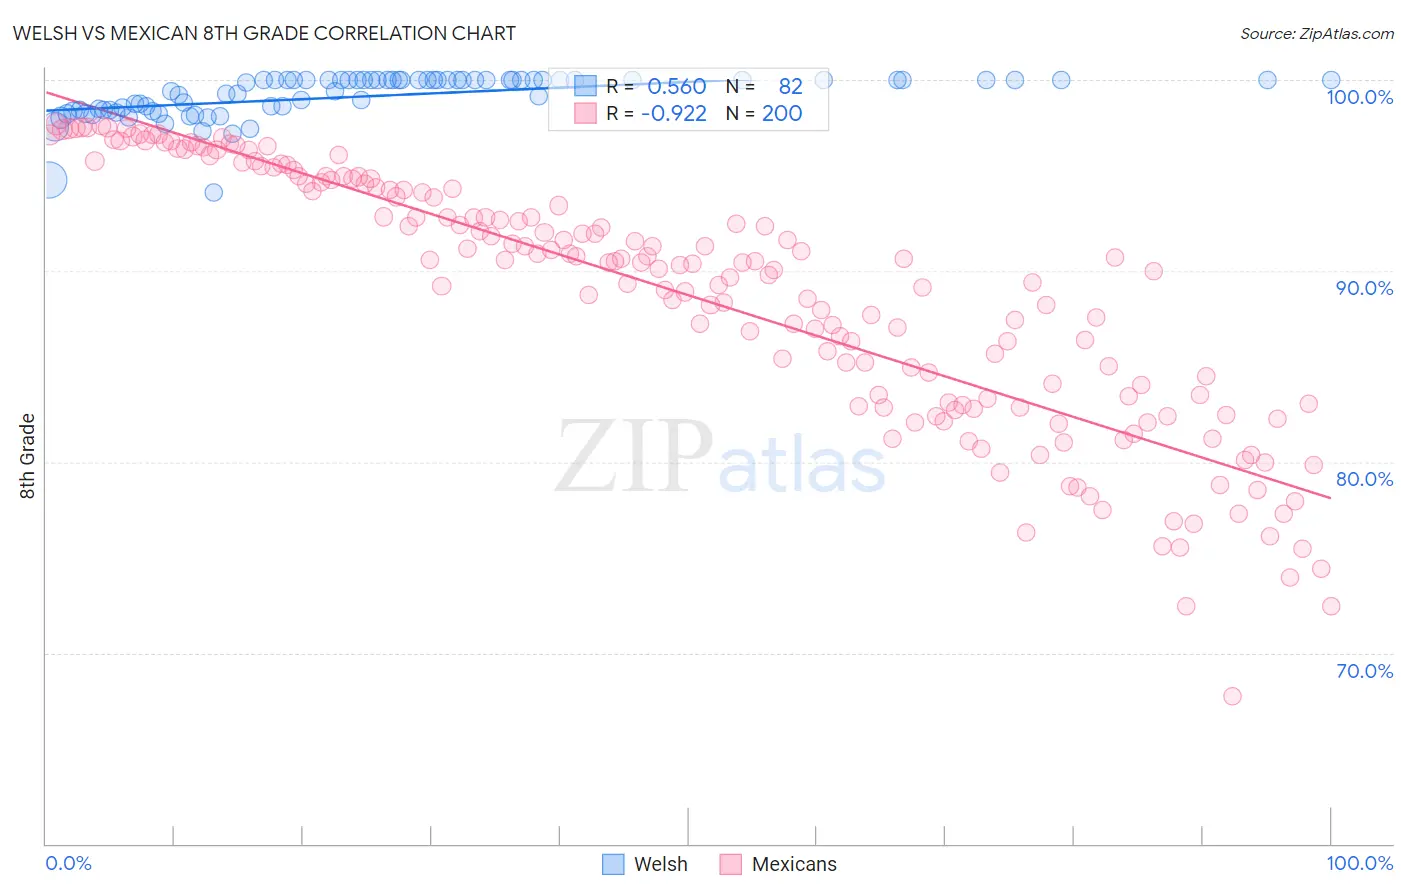
Welsh vs Mexican 8th Grade Correlation Chart
The statistical analysis conducted on geographies consisting of 528,593,877 people shows a substantial positive correlation between the proportion of Welsh and percentage of population with at least 8th grade education in the United States with a correlation coefficient (R) of 0.560 and weighted average of 97.2%. Similarly, the statistical analysis conducted on geographies consisting of 565,339,555 people shows a near-perfect negative correlation between the proportion of Mexicans and percentage of population with at least 8th grade education in the United States with a correlation coefficient (R) of -0.922 and weighted average of 91.4%, a difference of 6.4%.
8th Grade Correlation Summary
| Measurement | Welsh | Mexican |
| Minimum | 94.1% | 67.7% |
| Maximum | 100.0% | 97.7% |
| Range | 5.9% | 29.9% |
| Mean | 99.2% | 88.7% |
| Median | 100.0% | 90.4% |
| Interquartile 25% (IQ1) | 98.4% | 83.2% |
| Interquartile 75% (IQ3) | 100.0% | 94.5% |
| Interquartile Range (IQR) | 1.6% | 11.3% |
| Standard Deviation (Sample) | 1.1% | 6.7% |
| Standard Deviation (Population) | 1.1% | 6.7% |
Similar Demographics by 8th Grade
Demographics Similar to Welsh by 8th Grade
In terms of 8th grade, the demographic groups most similar to Welsh are French Canadian (97.2%, a difference of 0.010%), Scandinavian (97.2%, a difference of 0.010%), Czech (97.1%, a difference of 0.020%), Danish (97.2%, a difference of 0.030%), and French (97.1%, a difference of 0.030%).
| Demographics | Rating | Rank | 8th Grade |
| Pennsylvania Germans | 100.0 /100 | #15 | Exceptional 97.3% |
| Tlingit-Haida | 100.0 /100 | #16 | Exceptional 97.3% |
| Irish | 100.0 /100 | #17 | Exceptional 97.3% |
| Lithuanians | 100.0 /100 | #18 | Exceptional 97.3% |
| Scottish | 100.0 /100 | #19 | Exceptional 97.3% |
| Croatians | 100.0 /100 | #20 | Exceptional 97.2% |
| Danes | 100.0 /100 | #21 | Exceptional 97.2% |
| Welsh | 100.0 /100 | #22 | Exceptional 97.2% |
| French Canadians | 100.0 /100 | #23 | Exceptional 97.2% |
| Scandinavians | 100.0 /100 | #24 | Exceptional 97.2% |
| Czechs | 100.0 /100 | #25 | Exceptional 97.1% |
| French | 100.0 /100 | #26 | Exceptional 97.1% |
| Scotch-Irish | 100.0 /100 | #27 | Exceptional 97.1% |
| Italians | 100.0 /100 | #28 | Exceptional 97.1% |
| Europeans | 100.0 /100 | #29 | Exceptional 97.1% |
Demographics Similar to Mexicans by 8th Grade
In terms of 8th grade, the demographic groups most similar to Mexicans are Yakama (91.2%, a difference of 0.13%), Central American (91.6%, a difference of 0.23%), Guatemalan (91.1%, a difference of 0.24%), Immigrants from Latin America (91.7%, a difference of 0.37%), and Salvadoran (90.9%, a difference of 0.53%).
| Demographics | Rating | Rank | 8th Grade |
| Immigrants | Dominican Republic | 0.0 /100 | #332 | Tragic 92.3% |
| Hispanics or Latinos | 0.0 /100 | #333 | Tragic 92.2% |
| Immigrants | Yemen | 0.0 /100 | #334 | Tragic 92.1% |
| Mexican American Indians | 0.0 /100 | #335 | Tragic 92.1% |
| Immigrants | Honduras | 0.0 /100 | #336 | Tragic 91.9% |
| Immigrants | Latin America | 0.0 /100 | #337 | Tragic 91.7% |
| Central Americans | 0.0 /100 | #338 | Tragic 91.6% |
| Mexicans | 0.0 /100 | #339 | Tragic 91.4% |
| Yakama | 0.0 /100 | #340 | Tragic 91.2% |
| Guatemalans | 0.0 /100 | #341 | Tragic 91.1% |
| Salvadorans | 0.0 /100 | #342 | Tragic 90.9% |
| Immigrants | Guatemala | 0.0 /100 | #343 | Tragic 90.7% |
| Immigrants | Central America | 0.0 /100 | #344 | Tragic 90.4% |
| Immigrants | El Salvador | 0.0 /100 | #345 | Tragic 90.3% |
| Immigrants | Mexico | 0.0 /100 | #346 | Tragic 90.2% |