Welsh vs Belizean 8th Grade
COMPARE
Welsh
Belizean
8th Grade
8th Grade Comparison
Welsh
Belizeans
97.2%
8TH GRADE
100.0/ 100
METRIC RATING
22nd/ 347
METRIC RANK
93.1%
8TH GRADE
0.0/ 100
METRIC RATING
321st/ 347
METRIC RANK
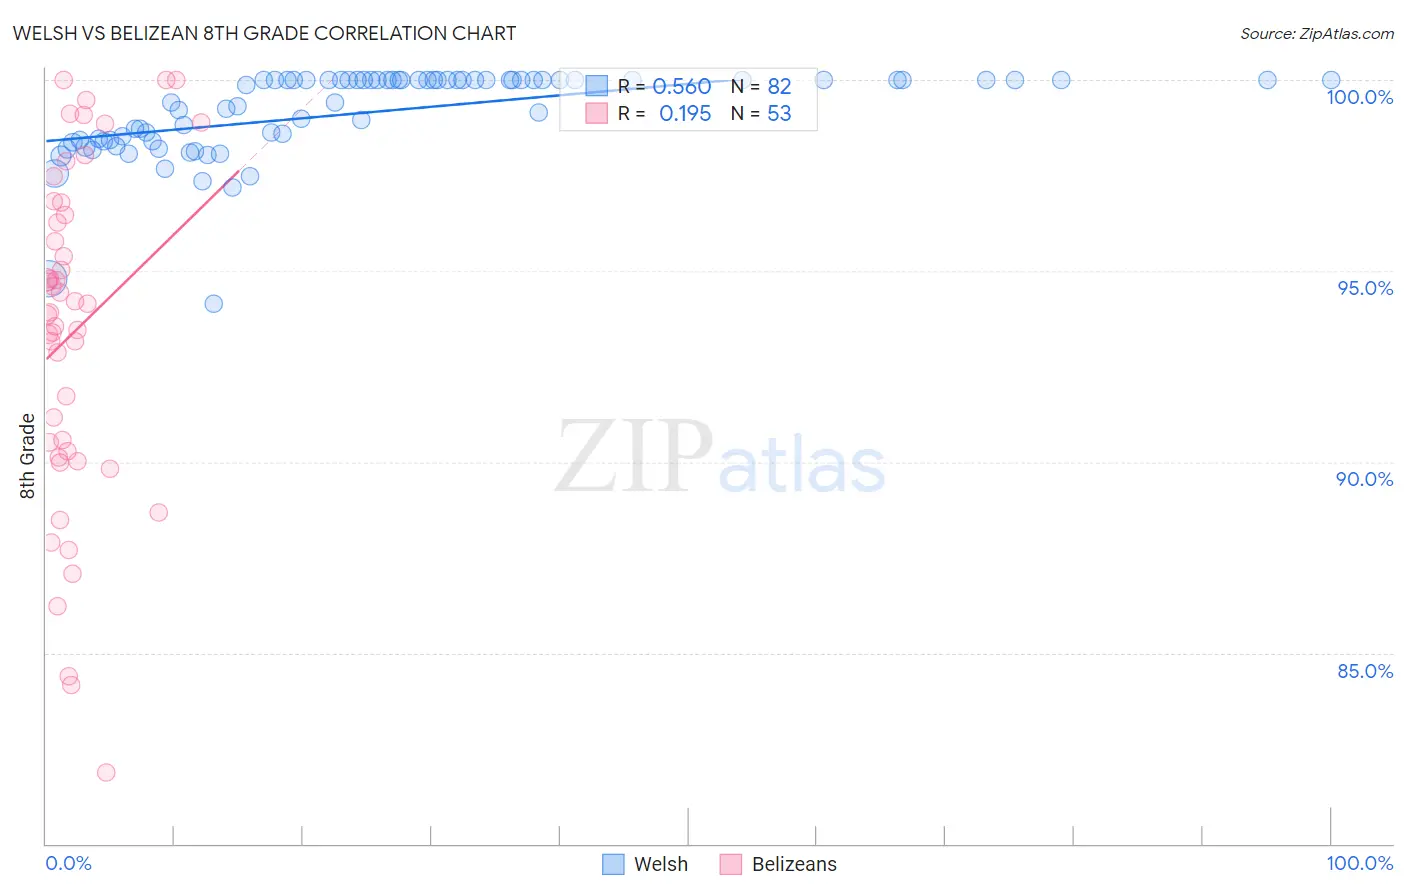
Welsh vs Belizean 8th Grade Correlation Chart
The statistical analysis conducted on geographies consisting of 528,593,877 people shows a substantial positive correlation between the proportion of Welsh and percentage of population with at least 8th grade education in the United States with a correlation coefficient (R) of 0.560 and weighted average of 97.2%. Similarly, the statistical analysis conducted on geographies consisting of 144,138,333 people shows a poor positive correlation between the proportion of Belizeans and percentage of population with at least 8th grade education in the United States with a correlation coefficient (R) of 0.195 and weighted average of 93.1%, a difference of 4.4%.
8th Grade Correlation Summary
| Measurement | Welsh | Belizean |
| Minimum | 94.1% | 81.9% |
| Maximum | 100.0% | 100.0% |
| Range | 5.9% | 18.1% |
| Mean | 99.2% | 93.4% |
| Median | 100.0% | 93.9% |
| Interquartile 25% (IQ1) | 98.4% | 90.2% |
| Interquartile 75% (IQ3) | 100.0% | 96.6% |
| Interquartile Range (IQR) | 1.6% | 6.4% |
| Standard Deviation (Sample) | 1.1% | 4.4% |
| Standard Deviation (Population) | 1.1% | 4.3% |
Similar Demographics by 8th Grade
Demographics Similar to Welsh by 8th Grade
In terms of 8th grade, the demographic groups most similar to Welsh are French Canadian (97.2%, a difference of 0.010%), Scandinavian (97.2%, a difference of 0.010%), Czech (97.1%, a difference of 0.020%), Danish (97.2%, a difference of 0.030%), and French (97.1%, a difference of 0.030%).
| Demographics | Rating | Rank | 8th Grade |
| Pennsylvania Germans | 100.0 /100 | #15 | Exceptional 97.3% |
| Tlingit-Haida | 100.0 /100 | #16 | Exceptional 97.3% |
| Irish | 100.0 /100 | #17 | Exceptional 97.3% |
| Lithuanians | 100.0 /100 | #18 | Exceptional 97.3% |
| Scottish | 100.0 /100 | #19 | Exceptional 97.3% |
| Croatians | 100.0 /100 | #20 | Exceptional 97.2% |
| Danes | 100.0 /100 | #21 | Exceptional 97.2% |
| Welsh | 100.0 /100 | #22 | Exceptional 97.2% |
| French Canadians | 100.0 /100 | #23 | Exceptional 97.2% |
| Scandinavians | 100.0 /100 | #24 | Exceptional 97.2% |
| Czechs | 100.0 /100 | #25 | Exceptional 97.1% |
| French | 100.0 /100 | #26 | Exceptional 97.1% |
| Scotch-Irish | 100.0 /100 | #27 | Exceptional 97.1% |
| Italians | 100.0 /100 | #28 | Exceptional 97.1% |
| Europeans | 100.0 /100 | #29 | Exceptional 97.1% |
Demographics Similar to Belizeans by 8th Grade
In terms of 8th grade, the demographic groups most similar to Belizeans are Nicaraguan (93.0%, a difference of 0.12%), Immigrants from Fiji (93.2%, a difference of 0.13%), Immigrants from Cuba (93.2%, a difference of 0.16%), Immigrants from Belize (92.9%, a difference of 0.17%), and Puerto Rican (93.2%, a difference of 0.19%).
| Demographics | Rating | Rank | 8th Grade |
| Immigrants | Vietnam | 0.0 /100 | #314 | Tragic 93.5% |
| Vietnamese | 0.0 /100 | #315 | Tragic 93.5% |
| Immigrants | Cambodia | 0.0 /100 | #316 | Tragic 93.3% |
| Immigrants | Ecuador | 0.0 /100 | #317 | Tragic 93.3% |
| Puerto Ricans | 0.0 /100 | #318 | Tragic 93.2% |
| Immigrants | Cuba | 0.0 /100 | #319 | Tragic 93.2% |
| Immigrants | Fiji | 0.0 /100 | #320 | Tragic 93.2% |
| Belizeans | 0.0 /100 | #321 | Tragic 93.1% |
| Nicaraguans | 0.0 /100 | #322 | Tragic 93.0% |
| Immigrants | Belize | 0.0 /100 | #323 | Tragic 92.9% |
| Nepalese | 0.0 /100 | #324 | Tragic 92.8% |
| Dominicans | 0.0 /100 | #325 | Tragic 92.8% |
| Central American Indians | 0.0 /100 | #326 | Tragic 92.7% |
| Immigrants | Azores | 0.0 /100 | #327 | Tragic 92.5% |
| Immigrants | Nicaragua | 0.0 /100 | #328 | Tragic 92.5% |