Welsh vs Russian 8th Grade
COMPARE
Welsh
Russian
8th Grade
8th Grade Comparison
Welsh
Russians
97.2%
8TH GRADE
100.0/ 100
METRIC RATING
22nd/ 347
METRIC RANK
96.7%
8TH GRADE
99.8/ 100
METRIC RATING
55th/ 347
METRIC RANK
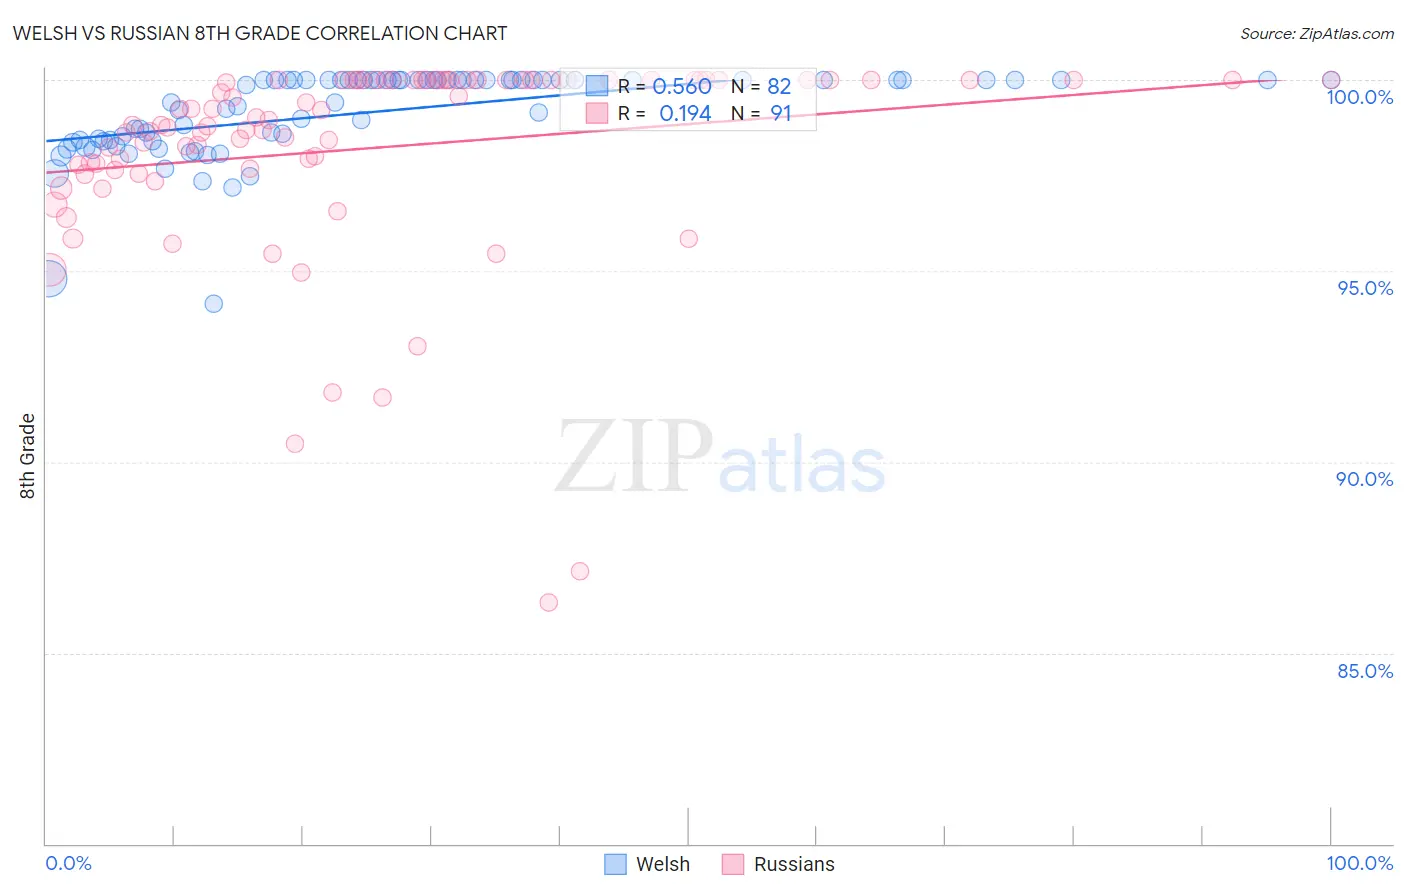
Welsh vs Russian 8th Grade Correlation Chart
The statistical analysis conducted on geographies consisting of 528,593,877 people shows a substantial positive correlation between the proportion of Welsh and percentage of population with at least 8th grade education in the United States with a correlation coefficient (R) of 0.560 and weighted average of 97.2%. Similarly, the statistical analysis conducted on geographies consisting of 512,259,047 people shows a poor positive correlation between the proportion of Russians and percentage of population with at least 8th grade education in the United States with a correlation coefficient (R) of 0.194 and weighted average of 96.7%, a difference of 0.44%.
8th Grade Correlation Summary
| Measurement | Welsh | Russian |
| Minimum | 94.1% | 86.3% |
| Maximum | 100.0% | 100.0% |
| Range | 5.9% | 13.7% |
| Mean | 99.2% | 98.2% |
| Median | 100.0% | 98.9% |
| Interquartile 25% (IQ1) | 98.4% | 97.7% |
| Interquartile 75% (IQ3) | 100.0% | 100.0% |
| Interquartile Range (IQR) | 1.6% | 2.3% |
| Standard Deviation (Sample) | 1.1% | 2.6% |
| Standard Deviation (Population) | 1.1% | 2.6% |
Similar Demographics by 8th Grade
Demographics Similar to Welsh by 8th Grade
In terms of 8th grade, the demographic groups most similar to Welsh are French Canadian (97.2%, a difference of 0.010%), Scandinavian (97.2%, a difference of 0.010%), Czech (97.1%, a difference of 0.020%), Danish (97.2%, a difference of 0.030%), and French (97.1%, a difference of 0.030%).
| Demographics | Rating | Rank | 8th Grade |
| Pennsylvania Germans | 100.0 /100 | #15 | Exceptional 97.3% |
| Tlingit-Haida | 100.0 /100 | #16 | Exceptional 97.3% |
| Irish | 100.0 /100 | #17 | Exceptional 97.3% |
| Lithuanians | 100.0 /100 | #18 | Exceptional 97.3% |
| Scottish | 100.0 /100 | #19 | Exceptional 97.3% |
| Croatians | 100.0 /100 | #20 | Exceptional 97.2% |
| Danes | 100.0 /100 | #21 | Exceptional 97.2% |
| Welsh | 100.0 /100 | #22 | Exceptional 97.2% |
| French Canadians | 100.0 /100 | #23 | Exceptional 97.2% |
| Scandinavians | 100.0 /100 | #24 | Exceptional 97.2% |
| Czechs | 100.0 /100 | #25 | Exceptional 97.1% |
| French | 100.0 /100 | #26 | Exceptional 97.1% |
| Scotch-Irish | 100.0 /100 | #27 | Exceptional 97.1% |
| Italians | 100.0 /100 | #28 | Exceptional 97.1% |
| Europeans | 100.0 /100 | #29 | Exceptional 97.1% |
Demographics Similar to Russians by 8th Grade
In terms of 8th grade, the demographic groups most similar to Russians are Serbian (96.7%, a difference of 0.0%), Australian (96.7%, a difference of 0.0%), Austrian (96.7%, a difference of 0.010%), Macedonian (96.7%, a difference of 0.010%), and Greek (96.8%, a difference of 0.030%).
| Demographics | Rating | Rank | 8th Grade |
| Slavs | 99.9 /100 | #48 | Exceptional 96.8% |
| Estonians | 99.9 /100 | #49 | Exceptional 96.8% |
| Immigrants | Scotland | 99.9 /100 | #50 | Exceptional 96.8% |
| Celtics | 99.9 /100 | #51 | Exceptional 96.8% |
| Greeks | 99.9 /100 | #52 | Exceptional 96.8% |
| Austrians | 99.9 /100 | #53 | Exceptional 96.7% |
| Serbians | 99.8 /100 | #54 | Exceptional 96.7% |
| Russians | 99.8 /100 | #55 | Exceptional 96.7% |
| Australians | 99.8 /100 | #56 | Exceptional 96.7% |
| Macedonians | 99.8 /100 | #57 | Exceptional 96.7% |
| Immigrants | Canada | 99.8 /100 | #58 | Exceptional 96.7% |
| Immigrants | North America | 99.8 /100 | #59 | Exceptional 96.7% |
| Immigrants | Northern Europe | 99.8 /100 | #60 | Exceptional 96.7% |
| Immigrants | Austria | 99.8 /100 | #61 | Exceptional 96.7% |
| Whites/Caucasians | 99.8 /100 | #62 | Exceptional 96.7% |