Marshallese vs Mexican 8th Grade
COMPARE
Marshallese
Mexican
8th Grade
8th Grade Comparison
Marshallese
Mexicans
95.7%
8TH GRADE
47.6/ 100
METRIC RATING
177th/ 347
METRIC RANK
91.4%
8TH GRADE
0.0/ 100
METRIC RATING
339th/ 347
METRIC RANK
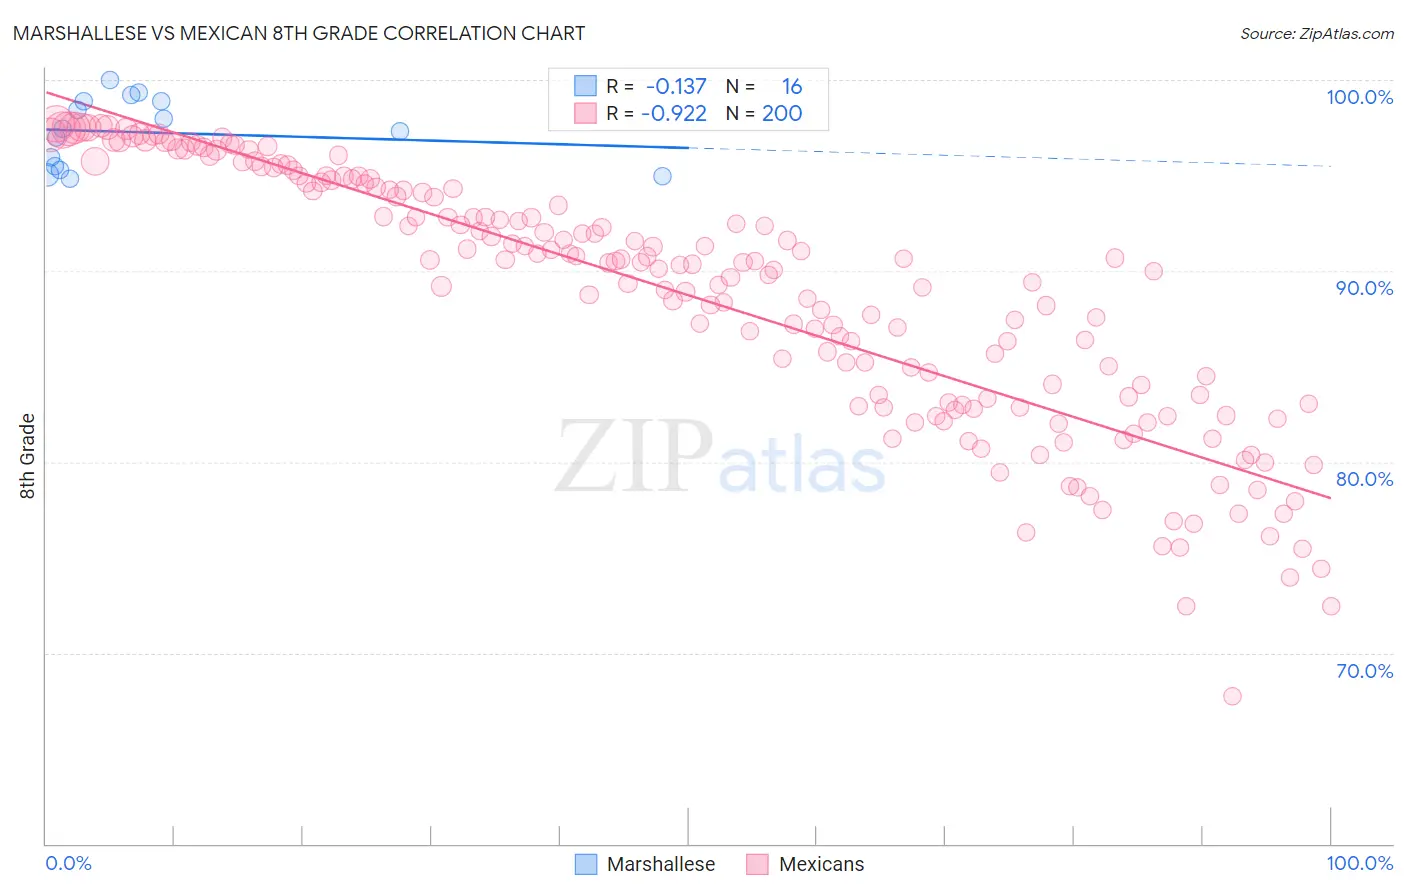
Marshallese vs Mexican 8th Grade Correlation Chart
The statistical analysis conducted on geographies consisting of 14,761,315 people shows a poor negative correlation between the proportion of Marshallese and percentage of population with at least 8th grade education in the United States with a correlation coefficient (R) of -0.137 and weighted average of 95.7%. Similarly, the statistical analysis conducted on geographies consisting of 565,339,555 people shows a near-perfect negative correlation between the proportion of Mexicans and percentage of population with at least 8th grade education in the United States with a correlation coefficient (R) of -0.922 and weighted average of 91.4%, a difference of 4.8%.
8th Grade Correlation Summary
| Measurement | Marshallese | Mexican |
| Minimum | 94.8% | 67.7% |
| Maximum | 100.0% | 97.7% |
| Range | 5.2% | 29.9% |
| Mean | 97.3% | 88.7% |
| Median | 97.4% | 90.4% |
| Interquartile 25% (IQ1) | 95.4% | 83.2% |
| Interquartile 75% (IQ3) | 98.9% | 94.5% |
| Interquartile Range (IQR) | 3.5% | 11.3% |
| Standard Deviation (Sample) | 1.8% | 6.7% |
| Standard Deviation (Population) | 1.7% | 6.7% |
Similar Demographics by 8th Grade
Demographics Similar to Marshallese by 8th Grade
In terms of 8th grade, the demographic groups most similar to Marshallese are Venezuelan (95.7%, a difference of 0.0%), Immigrants from Albania (95.7%, a difference of 0.010%), Pakistani (95.7%, a difference of 0.010%), Immigrants from Brazil (95.7%, a difference of 0.010%), and Chilean (95.7%, a difference of 0.020%).
| Demographics | Rating | Rank | 8th Grade |
| Ute | 58.5 /100 | #170 | Average 95.8% |
| Egyptians | 58.2 /100 | #171 | Average 95.8% |
| Immigrants | Korea | 57.9 /100 | #172 | Average 95.8% |
| Mongolians | 53.0 /100 | #173 | Average 95.8% |
| Chileans | 50.0 /100 | #174 | Average 95.7% |
| Immigrants | Albania | 49.6 /100 | #175 | Average 95.7% |
| Pakistanis | 48.8 /100 | #176 | Average 95.7% |
| Marshallese | 47.6 /100 | #177 | Average 95.7% |
| Venezuelans | 47.5 /100 | #178 | Average 95.7% |
| Immigrants | Brazil | 45.4 /100 | #179 | Average 95.7% |
| Iraqis | 40.5 /100 | #180 | Average 95.7% |
| Immigrants | Spain | 38.7 /100 | #181 | Fair 95.7% |
| Immigrants | Egypt | 37.9 /100 | #182 | Fair 95.7% |
| Immigrants | Iraq | 36.2 /100 | #183 | Fair 95.6% |
| Immigrants | Uganda | 36.0 /100 | #184 | Fair 95.6% |
Demographics Similar to Mexicans by 8th Grade
In terms of 8th grade, the demographic groups most similar to Mexicans are Yakama (91.2%, a difference of 0.13%), Central American (91.6%, a difference of 0.23%), Guatemalan (91.1%, a difference of 0.24%), Immigrants from Latin America (91.7%, a difference of 0.37%), and Salvadoran (90.9%, a difference of 0.53%).
| Demographics | Rating | Rank | 8th Grade |
| Immigrants | Dominican Republic | 0.0 /100 | #332 | Tragic 92.3% |
| Hispanics or Latinos | 0.0 /100 | #333 | Tragic 92.2% |
| Immigrants | Yemen | 0.0 /100 | #334 | Tragic 92.1% |
| Mexican American Indians | 0.0 /100 | #335 | Tragic 92.1% |
| Immigrants | Honduras | 0.0 /100 | #336 | Tragic 91.9% |
| Immigrants | Latin America | 0.0 /100 | #337 | Tragic 91.7% |
| Central Americans | 0.0 /100 | #338 | Tragic 91.6% |
| Mexicans | 0.0 /100 | #339 | Tragic 91.4% |
| Yakama | 0.0 /100 | #340 | Tragic 91.2% |
| Guatemalans | 0.0 /100 | #341 | Tragic 91.1% |
| Salvadorans | 0.0 /100 | #342 | Tragic 90.9% |
| Immigrants | Guatemala | 0.0 /100 | #343 | Tragic 90.7% |
| Immigrants | Central America | 0.0 /100 | #344 | Tragic 90.4% |
| Immigrants | El Salvador | 0.0 /100 | #345 | Tragic 90.3% |
| Immigrants | Mexico | 0.0 /100 | #346 | Tragic 90.2% |