Immigrants from Europe vs Mexican 8th Grade
COMPARE
Immigrants from Europe
Mexican
8th Grade
8th Grade Comparison
Immigrants from Europe
Mexicans
96.2%
8TH GRADE
95.3/ 100
METRIC RATING
122nd/ 347
METRIC RANK
91.4%
8TH GRADE
0.0/ 100
METRIC RATING
339th/ 347
METRIC RANK
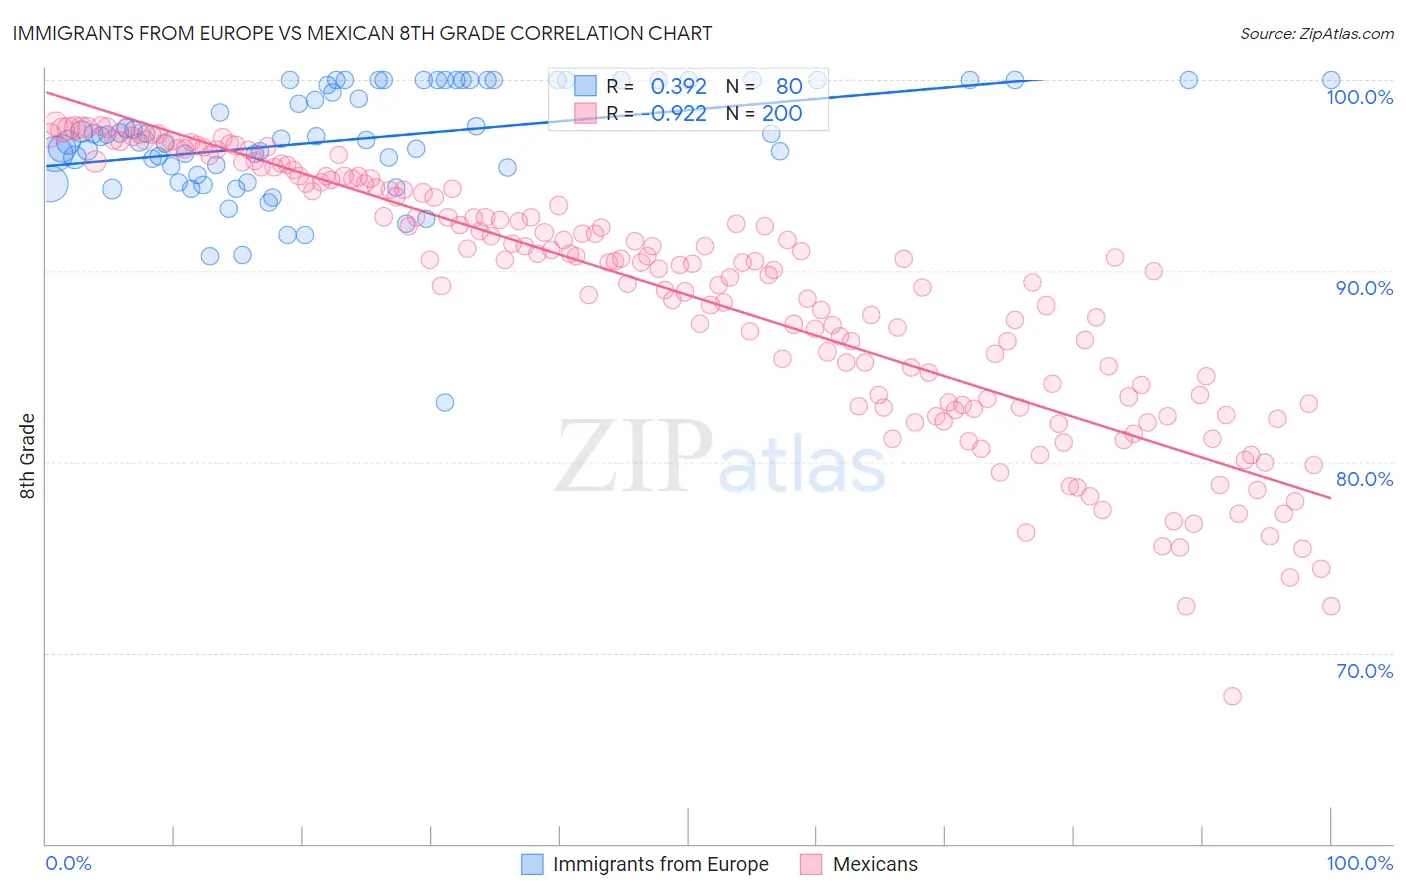
Immigrants from Europe vs Mexican 8th Grade Correlation Chart
The statistical analysis conducted on geographies consisting of 547,425,973 people shows a mild positive correlation between the proportion of Immigrants from Europe and percentage of population with at least 8th grade education in the United States with a correlation coefficient (R) of 0.392 and weighted average of 96.2%. Similarly, the statistical analysis conducted on geographies consisting of 565,339,555 people shows a near-perfect negative correlation between the proportion of Mexicans and percentage of population with at least 8th grade education in the United States with a correlation coefficient (R) of -0.922 and weighted average of 91.4%, a difference of 5.3%.
8th Grade Correlation Summary
| Measurement | Immigrants from Europe | Mexican |
| Minimum | 83.1% | 67.7% |
| Maximum | 100.0% | 97.7% |
| Range | 16.9% | 29.9% |
| Mean | 96.9% | 88.7% |
| Median | 97.1% | 90.4% |
| Interquartile 25% (IQ1) | 95.5% | 83.2% |
| Interquartile 75% (IQ3) | 100.0% | 94.5% |
| Interquartile Range (IQR) | 4.5% | 11.3% |
| Standard Deviation (Sample) | 3.0% | 6.7% |
| Standard Deviation (Population) | 3.0% | 6.7% |
Similar Demographics by 8th Grade
Demographics Similar to Immigrants from Europe by 8th Grade
In terms of 8th grade, the demographic groups most similar to Immigrants from Europe are Immigrants from Switzerland (96.2%, a difference of 0.0%), Immigrants from France (96.2%, a difference of 0.0%), Immigrants from Bulgaria (96.2%, a difference of 0.0%), Immigrants from Norway (96.2%, a difference of 0.020%), and Filipino (96.2%, a difference of 0.020%).
| Demographics | Rating | Rank | 8th Grade |
| Immigrants | Moldova | 96.5 /100 | #115 | Exceptional 96.2% |
| Immigrants | Nonimmigrants | 96.0 /100 | #116 | Exceptional 96.2% |
| Immigrants | Croatia | 96.0 /100 | #117 | Exceptional 96.2% |
| Immigrants | Norway | 95.7 /100 | #118 | Exceptional 96.2% |
| Immigrants | Switzerland | 95.3 /100 | #119 | Exceptional 96.2% |
| Immigrants | France | 95.3 /100 | #120 | Exceptional 96.2% |
| Immigrants | Bulgaria | 95.3 /100 | #121 | Exceptional 96.2% |
| Immigrants | Europe | 95.3 /100 | #122 | Exceptional 96.2% |
| Filipinos | 94.6 /100 | #123 | Exceptional 96.2% |
| Palestinians | 94.6 /100 | #124 | Exceptional 96.2% |
| Immigrants | Romania | 94.1 /100 | #125 | Exceptional 96.2% |
| Choctaw | 94.0 /100 | #126 | Exceptional 96.2% |
| Immigrants | Serbia | 94.0 /100 | #127 | Exceptional 96.2% |
| Immigrants | Bosnia and Herzegovina | 93.9 /100 | #128 | Exceptional 96.2% |
| Cheyenne | 93.3 /100 | #129 | Exceptional 96.1% |
Demographics Similar to Mexicans by 8th Grade
In terms of 8th grade, the demographic groups most similar to Mexicans are Yakama (91.2%, a difference of 0.13%), Central American (91.6%, a difference of 0.23%), Guatemalan (91.1%, a difference of 0.24%), Immigrants from Latin America (91.7%, a difference of 0.37%), and Salvadoran (90.9%, a difference of 0.53%).
| Demographics | Rating | Rank | 8th Grade |
| Immigrants | Dominican Republic | 0.0 /100 | #332 | Tragic 92.3% |
| Hispanics or Latinos | 0.0 /100 | #333 | Tragic 92.2% |
| Immigrants | Yemen | 0.0 /100 | #334 | Tragic 92.1% |
| Mexican American Indians | 0.0 /100 | #335 | Tragic 92.1% |
| Immigrants | Honduras | 0.0 /100 | #336 | Tragic 91.9% |
| Immigrants | Latin America | 0.0 /100 | #337 | Tragic 91.7% |
| Central Americans | 0.0 /100 | #338 | Tragic 91.6% |
| Mexicans | 0.0 /100 | #339 | Tragic 91.4% |
| Yakama | 0.0 /100 | #340 | Tragic 91.2% |
| Guatemalans | 0.0 /100 | #341 | Tragic 91.1% |
| Salvadorans | 0.0 /100 | #342 | Tragic 90.9% |
| Immigrants | Guatemala | 0.0 /100 | #343 | Tragic 90.7% |
| Immigrants | Central America | 0.0 /100 | #344 | Tragic 90.4% |
| Immigrants | El Salvador | 0.0 /100 | #345 | Tragic 90.3% |
| Immigrants | Mexico | 0.0 /100 | #346 | Tragic 90.2% |