Immigrants from Guyana vs Lebanese High School Diploma
COMPARE
Immigrants from Guyana
Lebanese
High School Diploma
High School Diploma Comparison
Immigrants from Guyana
Lebanese
85.3%
HIGH SCHOOL DIPLOMA
0.0/ 100
METRIC RATING
306th/ 347
METRIC RANK
90.4%
HIGH SCHOOL DIPLOMA
97.4/ 100
METRIC RATING
105th/ 347
METRIC RANK
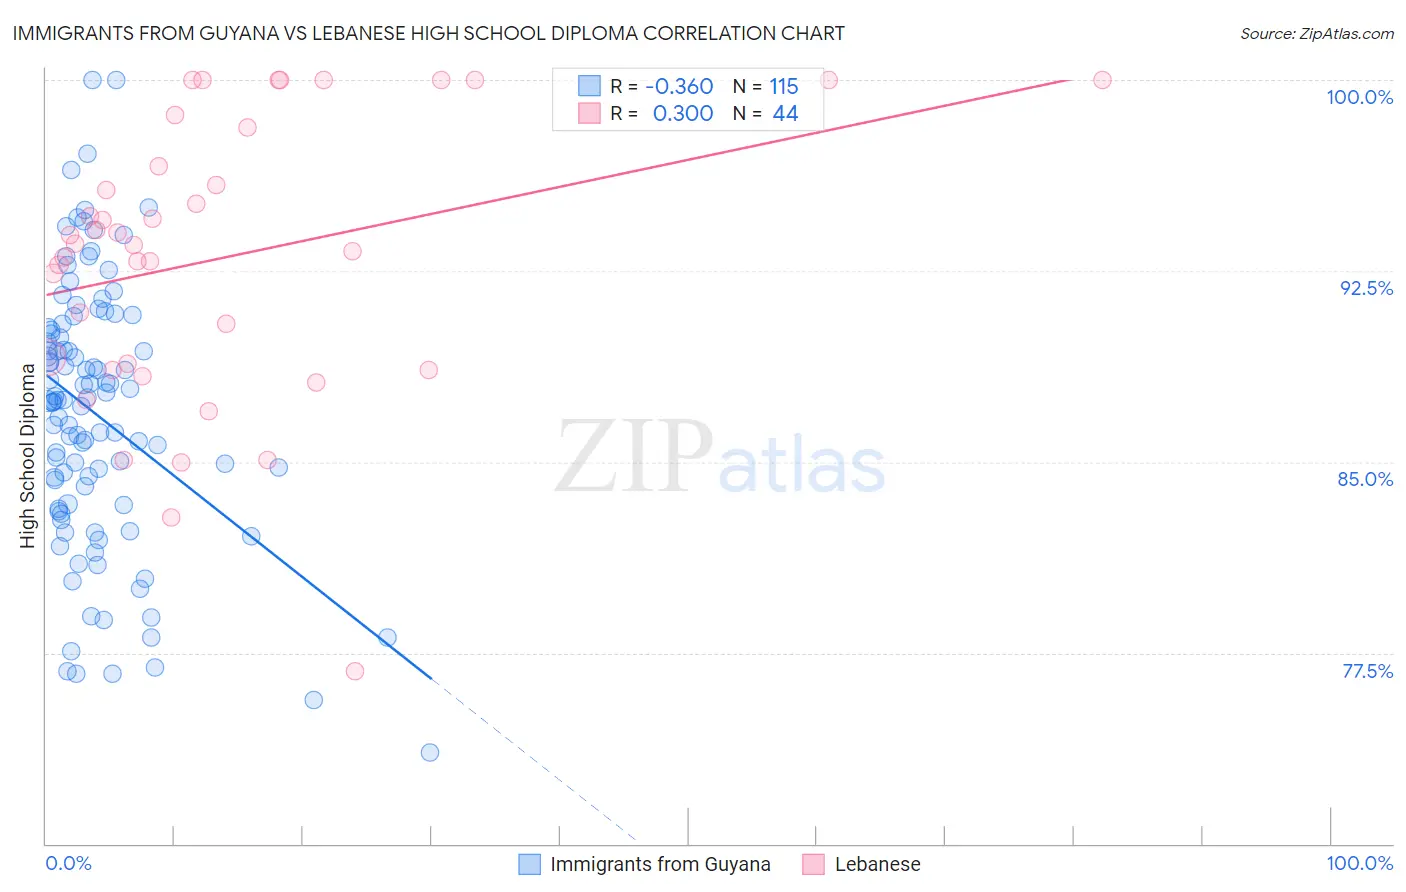
Immigrants from Guyana vs Lebanese High School Diploma Correlation Chart
The statistical analysis conducted on geographies consisting of 183,673,461 people shows a mild negative correlation between the proportion of Immigrants from Guyana and percentage of population with at least high school diploma education in the United States with a correlation coefficient (R) of -0.360 and weighted average of 85.3%. Similarly, the statistical analysis conducted on geographies consisting of 401,624,157 people shows a mild positive correlation between the proportion of Lebanese and percentage of population with at least high school diploma education in the United States with a correlation coefficient (R) of 0.300 and weighted average of 90.4%, a difference of 6.0%.
High School Diploma Correlation Summary
| Measurement | Immigrants from Guyana | Lebanese |
| Minimum | 73.6% | 76.8% |
| Maximum | 100.0% | 100.0% |
| Range | 26.4% | 23.2% |
| Mean | 86.8% | 93.0% |
| Median | 87.4% | 93.6% |
| Interquartile 25% (IQ1) | 83.3% | 88.7% |
| Interquartile 75% (IQ3) | 90.2% | 97.4% |
| Interquartile Range (IQR) | 6.9% | 8.6% |
| Standard Deviation (Sample) | 5.2% | 5.5% |
| Standard Deviation (Population) | 5.2% | 5.4% |
Similar Demographics by High School Diploma
Demographics Similar to Immigrants from Guyana by High School Diploma
In terms of high school diploma, the demographic groups most similar to Immigrants from Guyana are Nepalese (85.3%, a difference of 0.050%), Immigrants from Portugal (85.3%, a difference of 0.050%), Navajo (85.2%, a difference of 0.090%), Immigrants from Armenia (85.2%, a difference of 0.10%), and Immigrants from Dominica (85.2%, a difference of 0.11%).
| Demographics | Rating | Rank | High School Diploma |
| Guyanese | 0.0 /100 | #299 | Tragic 85.5% |
| Immigrants | Bangladesh | 0.0 /100 | #300 | Tragic 85.5% |
| Vietnamese | 0.0 /100 | #301 | Tragic 85.4% |
| Immigrants | Haiti | 0.0 /100 | #302 | Tragic 85.4% |
| Cubans | 0.0 /100 | #303 | Tragic 85.4% |
| Nepalese | 0.0 /100 | #304 | Tragic 85.3% |
| Immigrants | Portugal | 0.0 /100 | #305 | Tragic 85.3% |
| Immigrants | Guyana | 0.0 /100 | #306 | Tragic 85.3% |
| Navajo | 0.0 /100 | #307 | Tragic 85.2% |
| Immigrants | Armenia | 0.0 /100 | #308 | Tragic 85.2% |
| Immigrants | Dominica | 0.0 /100 | #309 | Tragic 85.2% |
| Apache | 0.0 /100 | #310 | Tragic 85.1% |
| Ecuadorians | 0.0 /100 | #311 | Tragic 85.1% |
| Cape Verdeans | 0.0 /100 | #312 | Tragic 85.1% |
| Immigrants | Ecuador | 0.0 /100 | #313 | Tragic 84.8% |
Demographics Similar to Lebanese by High School Diploma
In terms of high school diploma, the demographic groups most similar to Lebanese are Syrian (90.3%, a difference of 0.050%), Immigrants from Croatia (90.4%, a difference of 0.060%), Immigrants from Romania (90.4%, a difference of 0.070%), Immigrants from Russia (90.3%, a difference of 0.070%), and Palestinian (90.3%, a difference of 0.080%).
| Demographics | Rating | Rank | High School Diploma |
| Immigrants | Korea | 98.3 /100 | #98 | Exceptional 90.5% |
| Immigrants | Europe | 98.2 /100 | #99 | Exceptional 90.5% |
| Immigrants | North Macedonia | 98.1 /100 | #100 | Exceptional 90.5% |
| Immigrants | Norway | 98.0 /100 | #101 | Exceptional 90.5% |
| Aleuts | 98.0 /100 | #102 | Exceptional 90.4% |
| Immigrants | Romania | 97.8 /100 | #103 | Exceptional 90.4% |
| Immigrants | Croatia | 97.8 /100 | #104 | Exceptional 90.4% |
| Lebanese | 97.4 /100 | #105 | Exceptional 90.4% |
| Syrians | 97.0 /100 | #106 | Exceptional 90.3% |
| Immigrants | Russia | 96.9 /100 | #107 | Exceptional 90.3% |
| Palestinians | 96.7 /100 | #108 | Exceptional 90.3% |
| Immigrants | Zimbabwe | 96.7 /100 | #109 | Exceptional 90.3% |
| Immigrants | Greece | 96.6 /100 | #110 | Exceptional 90.3% |
| Menominee | 96.6 /100 | #111 | Exceptional 90.3% |
| Immigrants | Belarus | 96.4 /100 | #112 | Exceptional 90.2% |