Welsh vs Immigrants from China Master's Degree
COMPARE
Welsh
Immigrants from China
Master's Degree
Master's Degree Comparison
Welsh
Immigrants from China
14.6%
MASTER'S DEGREE
34.2/ 100
METRIC RATING
191st/ 347
METRIC RANK
21.2%
MASTER'S DEGREE
100.0/ 100
METRIC RATING
11th/ 347
METRIC RANK
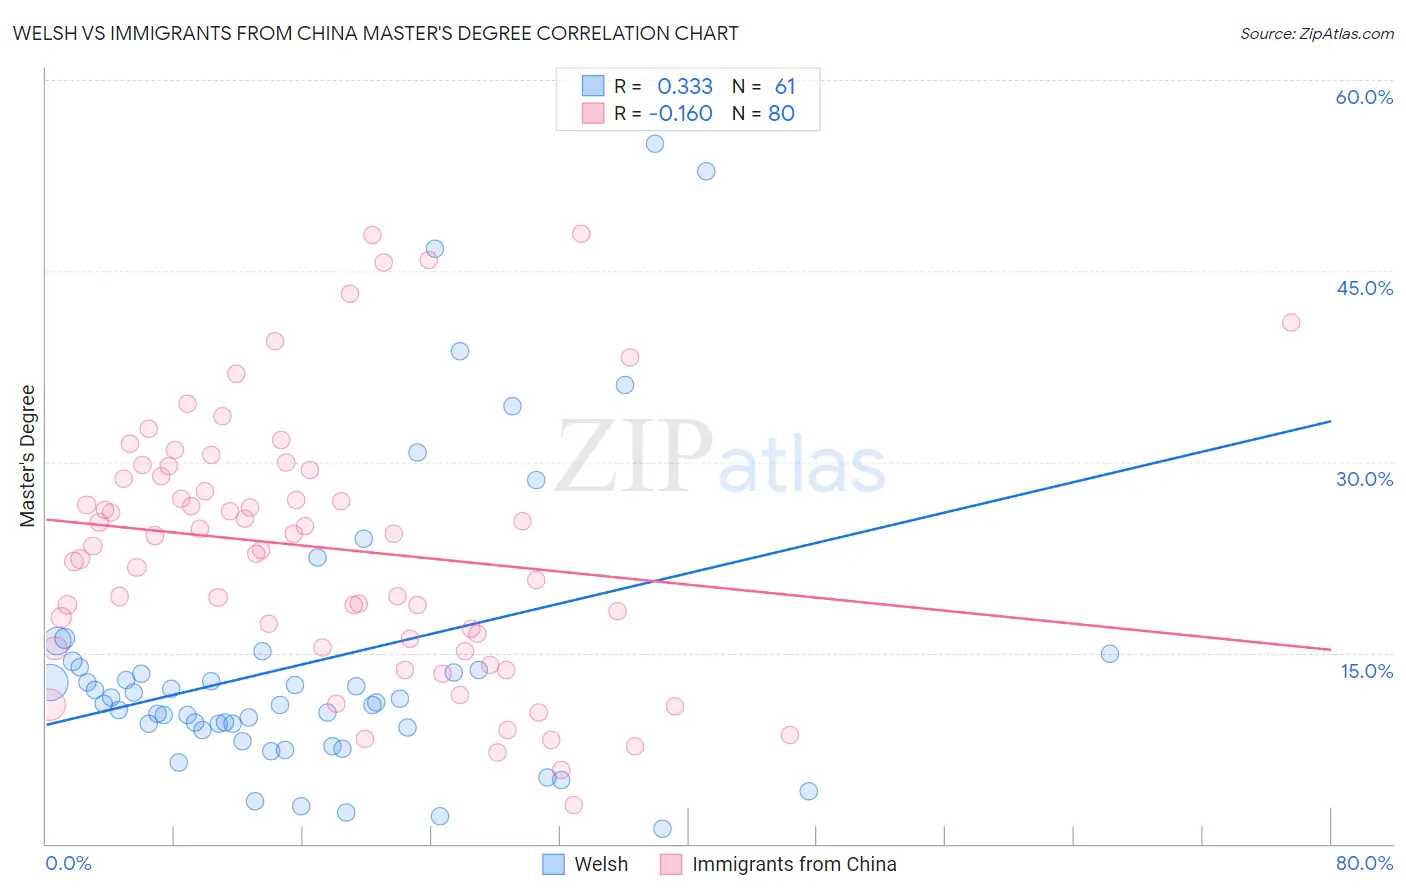
Welsh vs Immigrants from China Master's Degree Correlation Chart
The statistical analysis conducted on geographies consisting of 528,158,256 people shows a mild positive correlation between the proportion of Welsh and percentage of population with at least master's degree education in the United States with a correlation coefficient (R) of 0.333 and weighted average of 14.6%. Similarly, the statistical analysis conducted on geographies consisting of 456,812,214 people shows a poor negative correlation between the proportion of Immigrants from China and percentage of population with at least master's degree education in the United States with a correlation coefficient (R) of -0.160 and weighted average of 21.2%, a difference of 45.0%.
Master's Degree Correlation Summary
| Measurement | Welsh | Immigrants from China |
| Minimum | 1.2% | 3.0% |
| Maximum | 55.0% | 48.0% |
| Range | 53.8% | 44.9% |
| Mean | 14.4% | 23.2% |
| Median | 11.1% | 23.8% |
| Interquartile 25% (IQ1) | 9.0% | 15.8% |
| Interquartile 75% (IQ3) | 14.1% | 29.1% |
| Interquartile Range (IQR) | 5.1% | 13.3% |
| Standard Deviation (Sample) | 11.5% | 10.3% |
| Standard Deviation (Population) | 11.4% | 10.2% |
Similar Demographics by Master's Degree
Demographics Similar to Welsh by Master's Degree
In terms of master's degree, the demographic groups most similar to Welsh are Immigrants from Middle Africa (14.6%, a difference of 0.090%), Immigrants from Nigeria (14.6%, a difference of 0.22%), Spaniard (14.6%, a difference of 0.23%), Immigrants (14.6%, a difference of 0.25%), and Chinese (14.6%, a difference of 0.26%).
| Demographics | Rating | Rank | Master's Degree |
| Immigrants | Zaire | 39.5 /100 | #184 | Fair 14.7% |
| Barbadians | 38.3 /100 | #185 | Fair 14.7% |
| Immigrants | Oceania | 37.1 /100 | #186 | Fair 14.7% |
| Basques | 36.5 /100 | #187 | Fair 14.7% |
| Immigrants | Costa Rica | 36.2 /100 | #188 | Fair 14.7% |
| Immigrants | Immigrants | 36.0 /100 | #189 | Fair 14.6% |
| Spaniards | 35.8 /100 | #190 | Fair 14.6% |
| Welsh | 34.2 /100 | #191 | Fair 14.6% |
| Immigrants | Middle Africa | 33.6 /100 | #192 | Fair 14.6% |
| Immigrants | Nigeria | 32.7 /100 | #193 | Fair 14.6% |
| Chinese | 32.5 /100 | #194 | Fair 14.6% |
| Danes | 31.3 /100 | #195 | Fair 14.5% |
| Czechoslovakians | 29.9 /100 | #196 | Fair 14.5% |
| Belgians | 28.0 /100 | #197 | Fair 14.5% |
| West Indians | 27.4 /100 | #198 | Fair 14.5% |
Demographics Similar to Immigrants from China by Master's Degree
In terms of master's degree, the demographic groups most similar to Immigrants from China are Eastern European (21.1%, a difference of 0.32%), Immigrants from Australia (20.9%, a difference of 1.5%), Immigrants from Switzerland (20.9%, a difference of 1.5%), Immigrants from Eastern Asia (20.8%, a difference of 1.7%), and Immigrants from Belgium (20.8%, a difference of 2.0%).
| Demographics | Rating | Rank | Master's Degree |
| Okinawans | 100.0 /100 | #4 | Exceptional 22.6% |
| Immigrants | Taiwan | 100.0 /100 | #5 | Exceptional 22.5% |
| Immigrants | India | 100.0 /100 | #6 | Exceptional 22.3% |
| Iranians | 100.0 /100 | #7 | Exceptional 22.3% |
| Cypriots | 100.0 /100 | #8 | Exceptional 21.8% |
| Thais | 100.0 /100 | #9 | Exceptional 21.7% |
| Immigrants | Iran | 100.0 /100 | #10 | Exceptional 21.6% |
| Immigrants | China | 100.0 /100 | #11 | Exceptional 21.2% |
| Eastern Europeans | 100.0 /100 | #12 | Exceptional 21.1% |
| Immigrants | Australia | 100.0 /100 | #13 | Exceptional 20.9% |
| Immigrants | Switzerland | 100.0 /100 | #14 | Exceptional 20.9% |
| Immigrants | Eastern Asia | 100.0 /100 | #15 | Exceptional 20.8% |
| Immigrants | Belgium | 100.0 /100 | #16 | Exceptional 20.8% |
| Immigrants | South Central Asia | 100.0 /100 | #17 | Exceptional 20.7% |
| Soviet Union | 100.0 /100 | #18 | Exceptional 20.5% |