Palestinian vs Immigrants from Yemen 11th Grade
COMPARE
Palestinian
Immigrants from Yemen
11th Grade
11th Grade Comparison
Palestinians
Immigrants from Yemen
93.4%
11TH GRADE
97.7/ 100
METRIC RATING
115th/ 347
METRIC RANK
87.1%
11TH GRADE
0.0/ 100
METRIC RATING
333rd/ 347
METRIC RANK
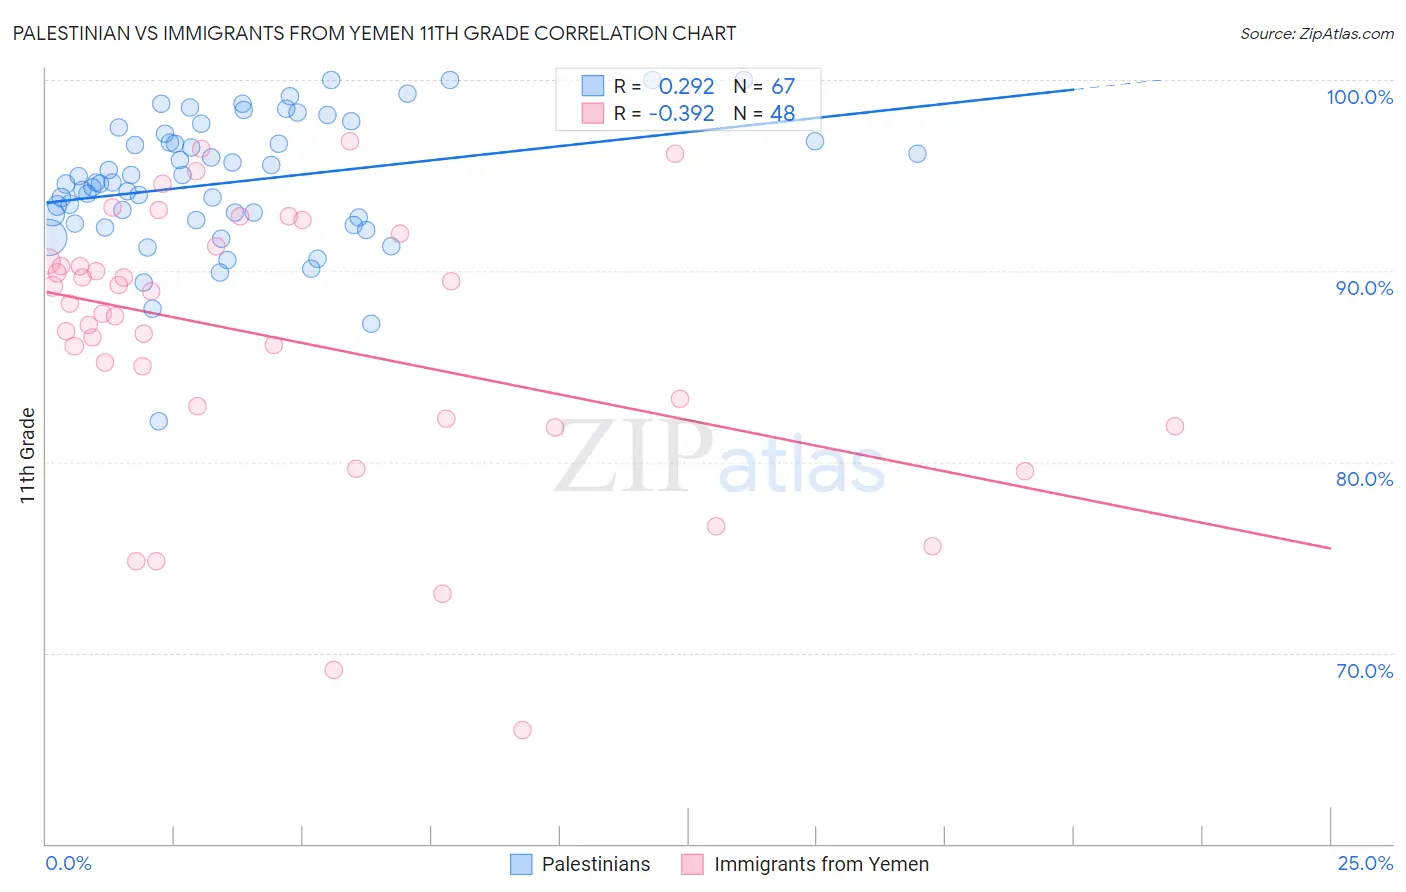
Palestinian vs Immigrants from Yemen 11th Grade Correlation Chart
The statistical analysis conducted on geographies consisting of 216,461,770 people shows a weak positive correlation between the proportion of Palestinians and percentage of population with at least 11th grade education in the United States with a correlation coefficient (R) of 0.292 and weighted average of 93.4%. Similarly, the statistical analysis conducted on geographies consisting of 82,421,120 people shows a mild negative correlation between the proportion of Immigrants from Yemen and percentage of population with at least 11th grade education in the United States with a correlation coefficient (R) of -0.392 and weighted average of 87.1%, a difference of 7.2%.
11th Grade Correlation Summary
| Measurement | Palestinian | Immigrants from Yemen |
| Minimum | 82.1% | 66.0% |
| Maximum | 100.0% | 96.8% |
| Range | 17.9% | 30.8% |
| Mean | 94.7% | 86.4% |
| Median | 94.6% | 88.0% |
| Interquartile 25% (IQ1) | 92.7% | 82.6% |
| Interquartile 75% (IQ3) | 97.2% | 90.9% |
| Interquartile Range (IQR) | 4.5% | 8.3% |
| Standard Deviation (Sample) | 3.4% | 7.2% |
| Standard Deviation (Population) | 3.4% | 7.1% |
Similar Demographics by 11th Grade
Demographics Similar to Palestinians by 11th Grade
In terms of 11th grade, the demographic groups most similar to Palestinians are Jordanian (93.4%, a difference of 0.010%), Immigrants from Zimbabwe (93.4%, a difference of 0.020%), Immigrants from Hungary (93.4%, a difference of 0.020%), White/Caucasian (93.3%, a difference of 0.030%), and Immigrants from Germany (93.4%, a difference of 0.040%).
| Demographics | Rating | Rank | 11th Grade |
| Alaska Natives | 98.4 /100 | #108 | Exceptional 93.5% |
| Immigrants | Kuwait | 98.4 /100 | #109 | Exceptional 93.5% |
| Syrians | 98.4 /100 | #110 | Exceptional 93.4% |
| Yugoslavians | 98.1 /100 | #111 | Exceptional 93.4% |
| Immigrants | Germany | 98.0 /100 | #112 | Exceptional 93.4% |
| Immigrants | Zimbabwe | 97.8 /100 | #113 | Exceptional 93.4% |
| Jordanians | 97.8 /100 | #114 | Exceptional 93.4% |
| Palestinians | 97.7 /100 | #115 | Exceptional 93.4% |
| Immigrants | Hungary | 97.5 /100 | #116 | Exceptional 93.4% |
| Whites/Caucasians | 97.4 /100 | #117 | Exceptional 93.3% |
| Immigrants | Korea | 97.0 /100 | #118 | Exceptional 93.3% |
| Israelis | 97.0 /100 | #119 | Exceptional 93.3% |
| Immigrants | Russia | 96.6 /100 | #120 | Exceptional 93.3% |
| German Russians | 96.4 /100 | #121 | Exceptional 93.3% |
| Immigrants | Belarus | 96.3 /100 | #122 | Exceptional 93.3% |
Demographics Similar to Immigrants from Yemen by 11th Grade
In terms of 11th grade, the demographic groups most similar to Immigrants from Yemen are Houma (87.0%, a difference of 0.060%), Central American (86.9%, a difference of 0.16%), Immigrants from the Azores (87.2%, a difference of 0.17%), Immigrants from Dominican Republic (86.9%, a difference of 0.20%), and Immigrants from Honduras (86.9%, a difference of 0.21%).
| Demographics | Rating | Rank | 11th Grade |
| Dominicans | 0.0 /100 | #326 | Tragic 87.7% |
| Immigrants | Cabo Verde | 0.0 /100 | #327 | Tragic 87.6% |
| Tohono O'odham | 0.0 /100 | #328 | Tragic 87.6% |
| Mexican American Indians | 0.0 /100 | #329 | Tragic 87.5% |
| Hondurans | 0.0 /100 | #330 | Tragic 87.4% |
| Hispanics or Latinos | 0.0 /100 | #331 | Tragic 87.3% |
| Immigrants | Azores | 0.0 /100 | #332 | Tragic 87.2% |
| Immigrants | Yemen | 0.0 /100 | #333 | Tragic 87.1% |
| Houma | 0.0 /100 | #334 | Tragic 87.0% |
| Central Americans | 0.0 /100 | #335 | Tragic 86.9% |
| Immigrants | Dominican Republic | 0.0 /100 | #336 | Tragic 86.9% |
| Immigrants | Honduras | 0.0 /100 | #337 | Tragic 86.9% |
| Immigrants | Latin America | 0.0 /100 | #338 | Tragic 86.8% |
| Guatemalans | 0.0 /100 | #339 | Tragic 86.4% |
| Salvadorans | 0.0 /100 | #340 | Tragic 86.2% |