Vietnamese vs Immigrants from Vietnam In Labor Force | Age 20-24
COMPARE
Vietnamese
Immigrants from Vietnam
In Labor Force | Age 20-24
In Labor Force | Age 20-24 Comparison
Vietnamese
Immigrants from Vietnam
70.6%
IN LABOR FORCE | AGE 20-24
0.0/ 100
METRIC RATING
330th/ 347
METRIC RANK
74.7%
IN LABOR FORCE | AGE 20-24
25.1/ 100
METRIC RATING
196th/ 347
METRIC RANK
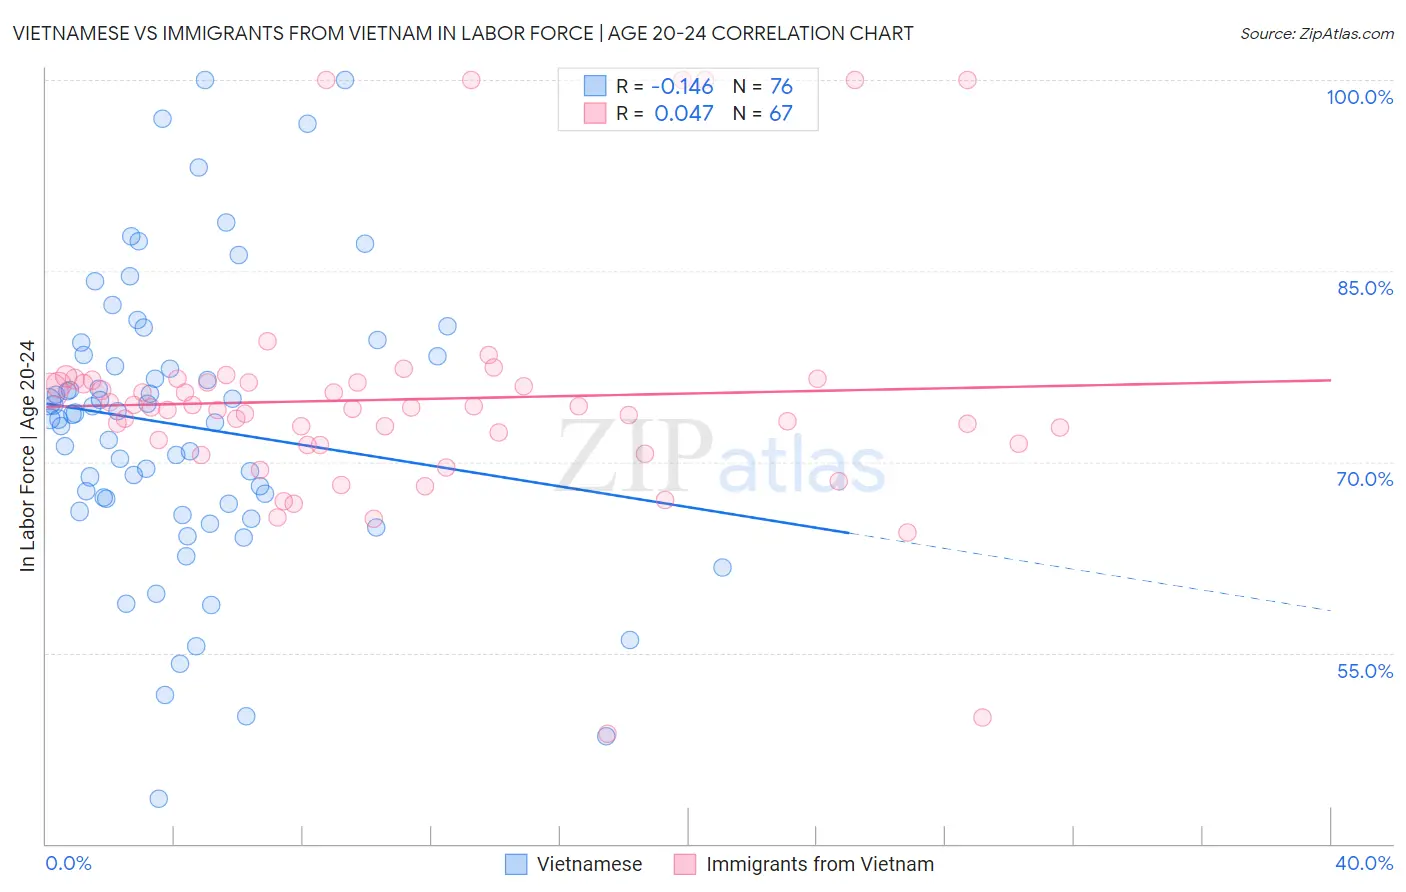
Vietnamese vs Immigrants from Vietnam In Labor Force | Age 20-24 Correlation Chart
The statistical analysis conducted on geographies consisting of 170,753,724 people shows a poor negative correlation between the proportion of Vietnamese and labor force participation rate among population between the ages 20 and 24 in the United States with a correlation coefficient (R) of -0.146 and weighted average of 70.6%. Similarly, the statistical analysis conducted on geographies consisting of 404,738,043 people shows no correlation between the proportion of Immigrants from Vietnam and labor force participation rate among population between the ages 20 and 24 in the United States with a correlation coefficient (R) of 0.047 and weighted average of 74.7%, a difference of 5.8%.
In Labor Force | Age 20-24 Correlation Summary
| Measurement | Vietnamese | Immigrants from Vietnam |
| Minimum | 43.5% | 48.6% |
| Maximum | 100.0% | 100.0% |
| Range | 56.5% | 51.4% |
| Mean | 72.8% | 74.9% |
| Median | 73.6% | 74.3% |
| Interquartile 25% (IQ1) | 66.4% | 71.4% |
| Interquartile 75% (IQ3) | 78.3% | 76.2% |
| Interquartile Range (IQR) | 11.9% | 4.8% |
| Standard Deviation (Sample) | 11.4% | 9.5% |
| Standard Deviation (Population) | 11.3% | 9.4% |
Similar Demographics by In Labor Force | Age 20-24
Demographics Similar to Vietnamese by In Labor Force | Age 20-24
In terms of in labor force | age 20-24, the demographic groups most similar to Vietnamese are Immigrants from Bangladesh (70.6%, a difference of 0.020%), Immigrants from Uzbekistan (70.4%, a difference of 0.33%), Yup'ik (70.9%, a difference of 0.35%), Yuman (70.3%, a difference of 0.55%), and Immigrants from China (71.1%, a difference of 0.59%).
| Demographics | Rating | Rank | In Labor Force | Age 20-24 |
| West Indians | 0.0 /100 | #323 | Tragic 71.3% |
| Immigrants | Dominican Republic | 0.0 /100 | #324 | Tragic 71.2% |
| Barbadians | 0.0 /100 | #325 | Tragic 71.1% |
| Dominicans | 0.0 /100 | #326 | Tragic 71.1% |
| Immigrants | Trinidad and Tobago | 0.0 /100 | #327 | Tragic 71.1% |
| Immigrants | China | 0.0 /100 | #328 | Tragic 71.1% |
| Yup'ik | 0.0 /100 | #329 | Tragic 70.9% |
| Vietnamese | 0.0 /100 | #330 | Tragic 70.6% |
| Immigrants | Bangladesh | 0.0 /100 | #331 | Tragic 70.6% |
| Immigrants | Uzbekistan | 0.0 /100 | #332 | Tragic 70.4% |
| Yuman | 0.0 /100 | #333 | Tragic 70.3% |
| British West Indians | 0.0 /100 | #334 | Tragic 70.0% |
| Immigrants | Barbados | 0.0 /100 | #335 | Tragic 69.7% |
| Immigrants | Guyana | 0.0 /100 | #336 | Tragic 69.3% |
| Guyanese | 0.0 /100 | #337 | Tragic 69.2% |
Demographics Similar to Immigrants from Vietnam by In Labor Force | Age 20-24
In terms of in labor force | age 20-24, the demographic groups most similar to Immigrants from Vietnam are Panamanian (74.7%, a difference of 0.0%), Immigrants from Denmark (74.8%, a difference of 0.010%), Eastern European (74.8%, a difference of 0.010%), Immigrants from Nigeria (74.7%, a difference of 0.020%), and Alsatian (74.8%, a difference of 0.040%).
| Demographics | Rating | Rank | In Labor Force | Age 20-24 |
| Immigrants | Northern Europe | 32.6 /100 | #189 | Fair 74.8% |
| Russians | 32.2 /100 | #190 | Fair 74.8% |
| Senegalese | 28.1 /100 | #191 | Fair 74.8% |
| Immigrants | Europe | 27.5 /100 | #192 | Fair 74.8% |
| Alsatians | 27.1 /100 | #193 | Fair 74.8% |
| Immigrants | Denmark | 25.8 /100 | #194 | Fair 74.8% |
| Eastern Europeans | 25.4 /100 | #195 | Fair 74.8% |
| Immigrants | Vietnam | 25.1 /100 | #196 | Fair 74.7% |
| Panamanians | 25.0 /100 | #197 | Fair 74.7% |
| Immigrants | Nigeria | 24.2 /100 | #198 | Fair 74.7% |
| Taiwanese | 23.2 /100 | #199 | Fair 74.7% |
| Nigerians | 21.9 /100 | #200 | Fair 74.7% |
| Choctaw | 21.4 /100 | #201 | Fair 74.7% |
| Moroccans | 20.4 /100 | #202 | Fair 74.7% |
| Immigrants | Northern Africa | 17.9 /100 | #203 | Poor 74.6% |