Vietnamese vs Immigrants from South Central Asia In Labor Force | Age 30-34
COMPARE
Vietnamese
Immigrants from South Central Asia
In Labor Force | Age 30-34
In Labor Force | Age 30-34 Comparison
Vietnamese
Immigrants from South Central Asia
83.6%
IN LABOR FORCE | AGE 30-34
0.1/ 100
METRIC RATING
269th/ 347
METRIC RANK
85.1%
IN LABOR FORCE | AGE 30-34
94.6/ 100
METRIC RATING
115th/ 347
METRIC RANK
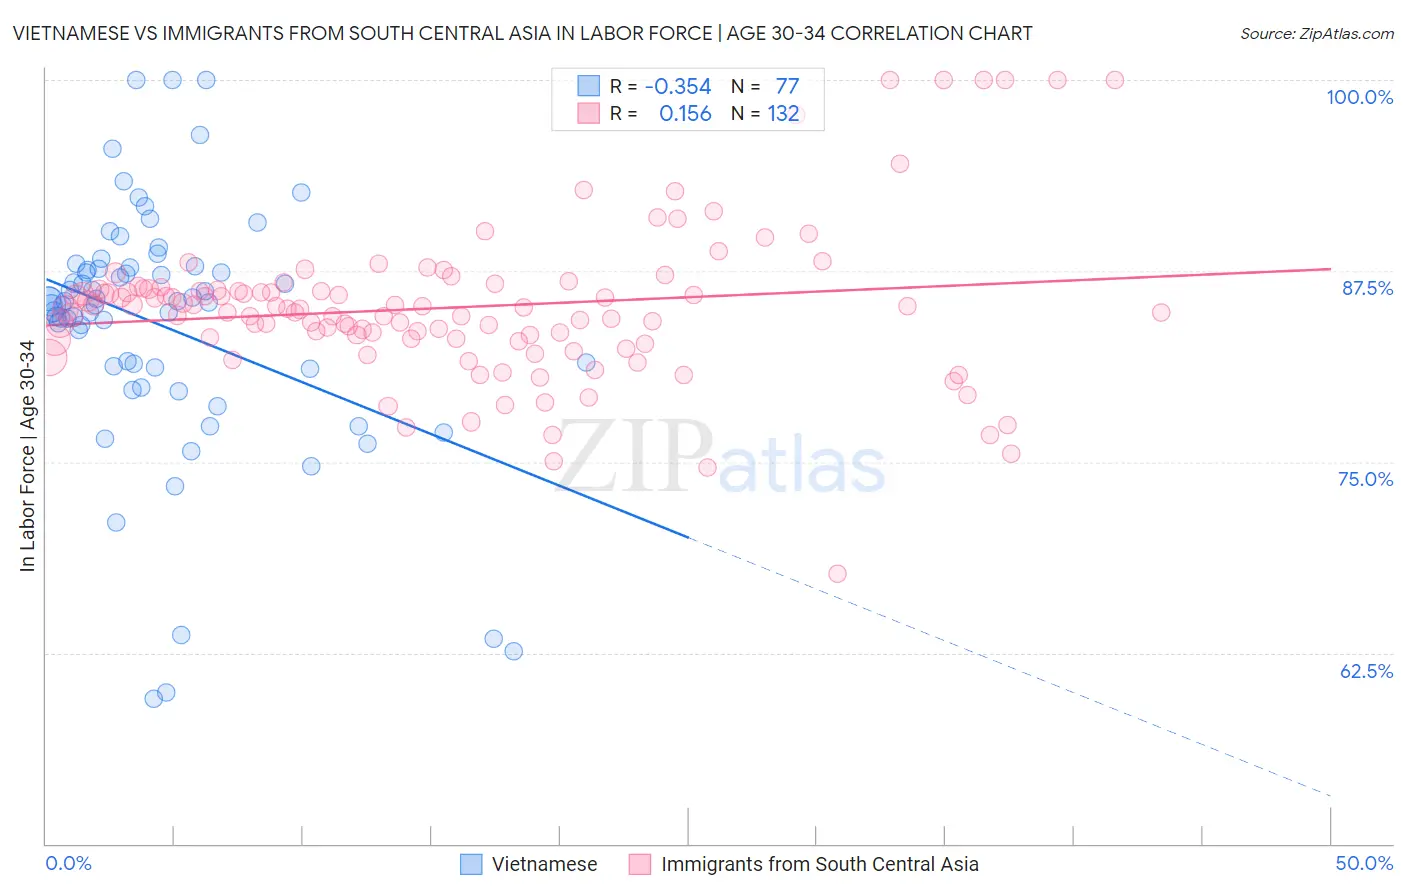
Vietnamese vs Immigrants from South Central Asia In Labor Force | Age 30-34 Correlation Chart
The statistical analysis conducted on geographies consisting of 170,686,461 people shows a mild negative correlation between the proportion of Vietnamese and labor force participation rate among population between the ages 30 and 34 in the United States with a correlation coefficient (R) of -0.354 and weighted average of 83.6%. Similarly, the statistical analysis conducted on geographies consisting of 472,668,502 people shows a poor positive correlation between the proportion of Immigrants from South Central Asia and labor force participation rate among population between the ages 30 and 34 in the United States with a correlation coefficient (R) of 0.156 and weighted average of 85.1%, a difference of 1.8%.
In Labor Force | Age 30-34 Correlation Summary
| Measurement | Vietnamese | Immigrants from South Central Asia |
| Minimum | 59.5% | 67.7% |
| Maximum | 100.0% | 100.0% |
| Range | 40.5% | 32.3% |
| Mean | 83.9% | 85.1% |
| Median | 85.3% | 85.0% |
| Interquartile 25% (IQ1) | 81.1% | 83.1% |
| Interquartile 75% (IQ3) | 87.7% | 86.3% |
| Interquartile Range (IQR) | 6.6% | 3.2% |
| Standard Deviation (Sample) | 8.2% | 5.1% |
| Standard Deviation (Population) | 8.1% | 5.1% |
Similar Demographics by In Labor Force | Age 30-34
Demographics Similar to Vietnamese by In Labor Force | Age 30-34
In terms of in labor force | age 30-34, the demographic groups most similar to Vietnamese are Immigrants from Bangladesh (83.6%, a difference of 0.010%), Spaniard (83.6%, a difference of 0.020%), Spanish American (83.5%, a difference of 0.050%), Spanish (83.5%, a difference of 0.070%), and Nonimmigrants (83.5%, a difference of 0.070%).
| Demographics | Rating | Rank | In Labor Force | Age 30-34 |
| Dominicans | 0.2 /100 | #262 | Tragic 83.8% |
| Immigrants | Guyana | 0.2 /100 | #263 | Tragic 83.8% |
| Guatemalans | 0.2 /100 | #264 | Tragic 83.7% |
| Immigrants | Honduras | 0.1 /100 | #265 | Tragic 83.7% |
| Immigrants | Guatemala | 0.1 /100 | #266 | Tragic 83.7% |
| Spaniards | 0.1 /100 | #267 | Tragic 83.6% |
| Immigrants | Bangladesh | 0.1 /100 | #268 | Tragic 83.6% |
| Vietnamese | 0.1 /100 | #269 | Tragic 83.6% |
| Spanish Americans | 0.0 /100 | #270 | Tragic 83.5% |
| Spanish | 0.0 /100 | #271 | Tragic 83.5% |
| Immigrants | Nonimmigrants | 0.0 /100 | #272 | Tragic 83.5% |
| Guamanians/Chamorros | 0.0 /100 | #273 | Tragic 83.5% |
| Belizeans | 0.0 /100 | #274 | Tragic 83.5% |
| Immigrants | Grenada | 0.0 /100 | #275 | Tragic 83.5% |
| Tongans | 0.0 /100 | #276 | Tragic 83.5% |
Demographics Similar to Immigrants from South Central Asia by In Labor Force | Age 30-34
In terms of in labor force | age 30-34, the demographic groups most similar to Immigrants from South Central Asia are Immigrants from Romania (85.1%, a difference of 0.0%), Yugoslavian (85.1%, a difference of 0.0%), Egyptian (85.1%, a difference of 0.0%), Immigrants from Scotland (85.1%, a difference of 0.010%), and Immigrants from Hungary (85.1%, a difference of 0.010%).
| Demographics | Rating | Rank | In Labor Force | Age 30-34 |
| Immigrants | Zimbabwe | 95.8 /100 | #108 | Exceptional 85.1% |
| Argentineans | 95.8 /100 | #109 | Exceptional 85.1% |
| Immigrants | South Africa | 95.3 /100 | #110 | Exceptional 85.1% |
| Immigrants | Scotland | 94.9 /100 | #111 | Exceptional 85.1% |
| Immigrants | Hungary | 94.8 /100 | #112 | Exceptional 85.1% |
| Immigrants | Romania | 94.7 /100 | #113 | Exceptional 85.1% |
| Yugoslavians | 94.7 /100 | #114 | Exceptional 85.1% |
| Immigrants | South Central Asia | 94.6 /100 | #115 | Exceptional 85.1% |
| Egyptians | 94.5 /100 | #116 | Exceptional 85.1% |
| Immigrants | Denmark | 94.3 /100 | #117 | Exceptional 85.1% |
| Immigrants | Malaysia | 94.2 /100 | #118 | Exceptional 85.1% |
| Asians | 93.4 /100 | #119 | Exceptional 85.1% |
| Immigrants | Southern Europe | 93.3 /100 | #120 | Exceptional 85.1% |
| Immigrants | Egypt | 93.2 /100 | #121 | Exceptional 85.1% |
| Immigrants | Kuwait | 92.6 /100 | #122 | Exceptional 85.1% |