European vs Pima No Schooling Completed
COMPARE
European
Pima
No Schooling Completed
No Schooling Completed Comparison
Europeans
Pima
1.5%
NO SCHOOLING COMPLETED
100.0/ 100
METRIC RATING
23rd/ 347
METRIC RANK
2.1%
NO SCHOOLING COMPLETED
41.3/ 100
METRIC RATING
184th/ 347
METRIC RANK
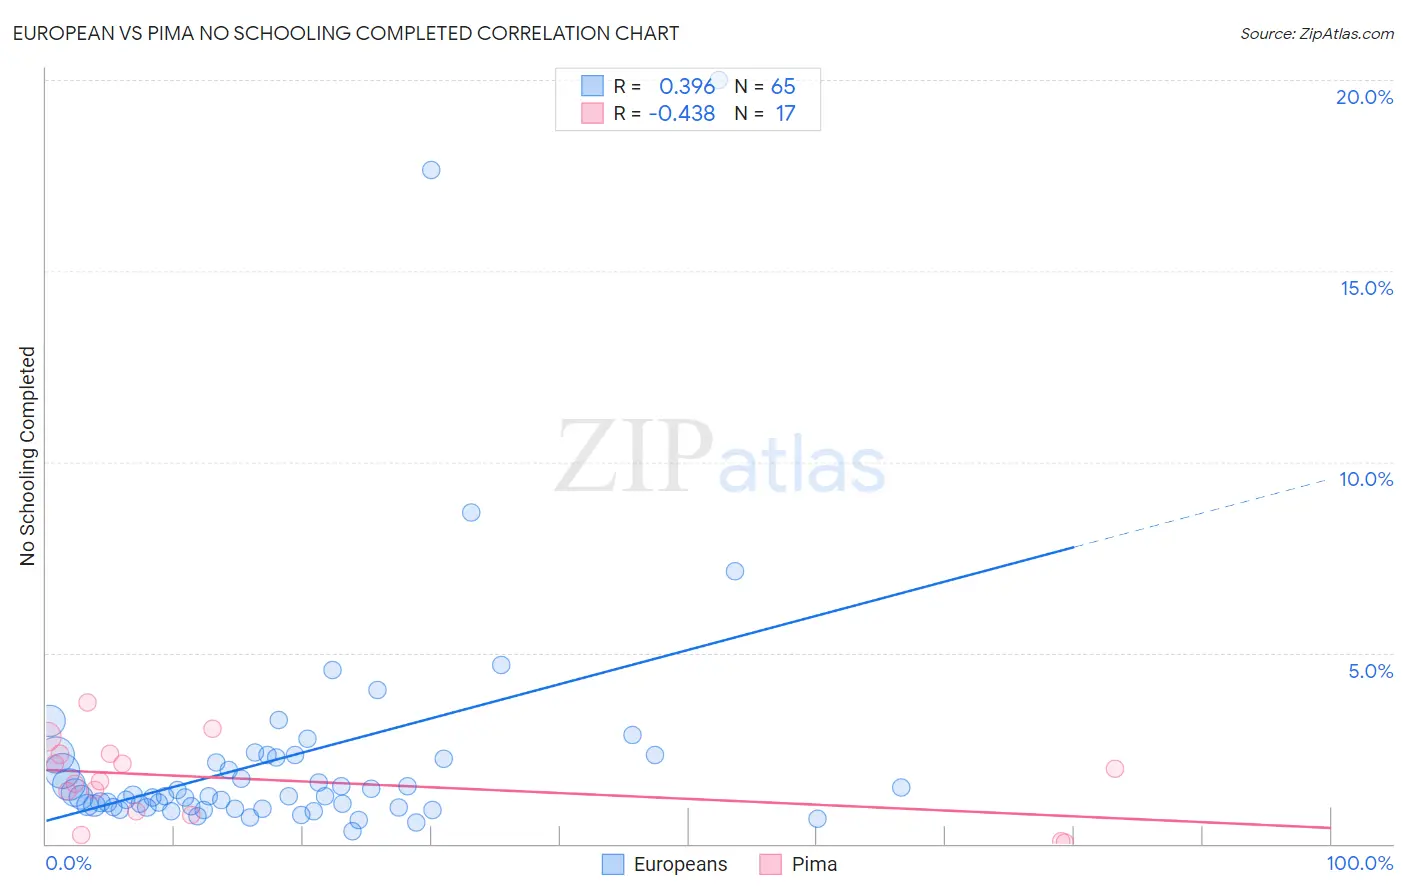
European vs Pima No Schooling Completed Correlation Chart
The statistical analysis conducted on geographies consisting of 544,915,278 people shows a mild positive correlation between the proportion of Europeans and percentage of population with no schooling in the United States with a correlation coefficient (R) of 0.396 and weighted average of 1.5%. Similarly, the statistical analysis conducted on geographies consisting of 61,416,926 people shows a moderate negative correlation between the proportion of Pima and percentage of population with no schooling in the United States with a correlation coefficient (R) of -0.438 and weighted average of 2.1%, a difference of 43.1%.
No Schooling Completed Correlation Summary
| Measurement | European | Pima |
| Minimum | 0.31% | 0.035% |
| Maximum | 20.0% | 3.7% |
| Range | 19.7% | 3.7% |
| Mean | 2.3% | 1.7% |
| Median | 1.2% | 1.6% |
| Interquartile 25% (IQ1) | 0.96% | 0.80% |
| Interquartile 75% (IQ3) | 2.3% | 2.3% |
| Interquartile Range (IQR) | 1.3% | 1.5% |
| Standard Deviation (Sample) | 3.3% | 1.0% |
| Standard Deviation (Population) | 3.3% | 1.0% |
Similar Demographics by No Schooling Completed
Demographics Similar to Europeans by No Schooling Completed
In terms of no schooling completed, the demographic groups most similar to Europeans are Alaska Native (1.5%, a difference of 0.25%), Chinese (1.5%, a difference of 0.34%), Pennsylvania German (1.5%, a difference of 0.35%), French (1.5%, a difference of 0.37%), and Welsh (1.5%, a difference of 0.71%).
| Demographics | Rating | Rank | No Schooling Completed |
| Finns | 100.0 /100 | #16 | Exceptional 1.5% |
| Croatians | 100.0 /100 | #17 | Exceptional 1.5% |
| Danes | 100.0 /100 | #18 | Exceptional 1.5% |
| Alaskan Athabascans | 100.0 /100 | #19 | Exceptional 1.5% |
| Welsh | 100.0 /100 | #20 | Exceptional 1.5% |
| Chinese | 100.0 /100 | #21 | Exceptional 1.5% |
| Alaska Natives | 100.0 /100 | #22 | Exceptional 1.5% |
| Europeans | 100.0 /100 | #23 | Exceptional 1.5% |
| Pennsylvania Germans | 100.0 /100 | #24 | Exceptional 1.5% |
| French | 100.0 /100 | #25 | Exceptional 1.5% |
| Czechs | 100.0 /100 | #26 | Exceptional 1.5% |
| Scandinavians | 100.0 /100 | #27 | Exceptional 1.5% |
| French Canadians | 100.0 /100 | #28 | Exceptional 1.5% |
| Lumbee | 100.0 /100 | #29 | Exceptional 1.5% |
| British | 100.0 /100 | #30 | Exceptional 1.5% |
Demographics Similar to Pima by No Schooling Completed
In terms of no schooling completed, the demographic groups most similar to Pima are Black/African American (2.1%, a difference of 0.020%), Mongolian (2.1%, a difference of 0.070%), French American Indian (2.1%, a difference of 0.12%), Immigrants from Taiwan (2.1%, a difference of 0.17%), and Portuguese (2.1%, a difference of 0.35%).
| Demographics | Rating | Rank | No Schooling Completed |
| Arapaho | 45.0 /100 | #177 | Average 2.1% |
| Pakistanis | 44.7 /100 | #178 | Average 2.1% |
| Immigrants | Kazakhstan | 44.3 /100 | #179 | Average 2.1% |
| Portuguese | 43.9 /100 | #180 | Average 2.1% |
| Immigrants | Taiwan | 42.6 /100 | #181 | Average 2.1% |
| French American Indians | 42.2 /100 | #182 | Average 2.1% |
| Blacks/African Americans | 41.4 /100 | #183 | Average 2.1% |
| Pima | 41.3 /100 | #184 | Average 2.1% |
| Mongolians | 40.8 /100 | #185 | Average 2.1% |
| Immigrants | Bosnia and Herzegovina | 38.6 /100 | #186 | Fair 2.1% |
| Navajo | 36.5 /100 | #187 | Fair 2.1% |
| Immigrants | Kenya | 36.2 /100 | #188 | Fair 2.1% |
| Immigrants | Egypt | 36.1 /100 | #189 | Fair 2.1% |
| Spanish Americans | 32.6 /100 | #190 | Fair 2.1% |
| Bermudans | 30.7 /100 | #191 | Fair 2.1% |