Immigrants from Eritrea vs Pima No Schooling Completed
COMPARE
Immigrants from Eritrea
Pima
No Schooling Completed
No Schooling Completed Comparison
Immigrants from Eritrea
Pima
2.8%
NO SCHOOLING COMPLETED
0.0/ 100
METRIC RATING
294th/ 347
METRIC RANK
2.1%
NO SCHOOLING COMPLETED
41.3/ 100
METRIC RATING
184th/ 347
METRIC RANK
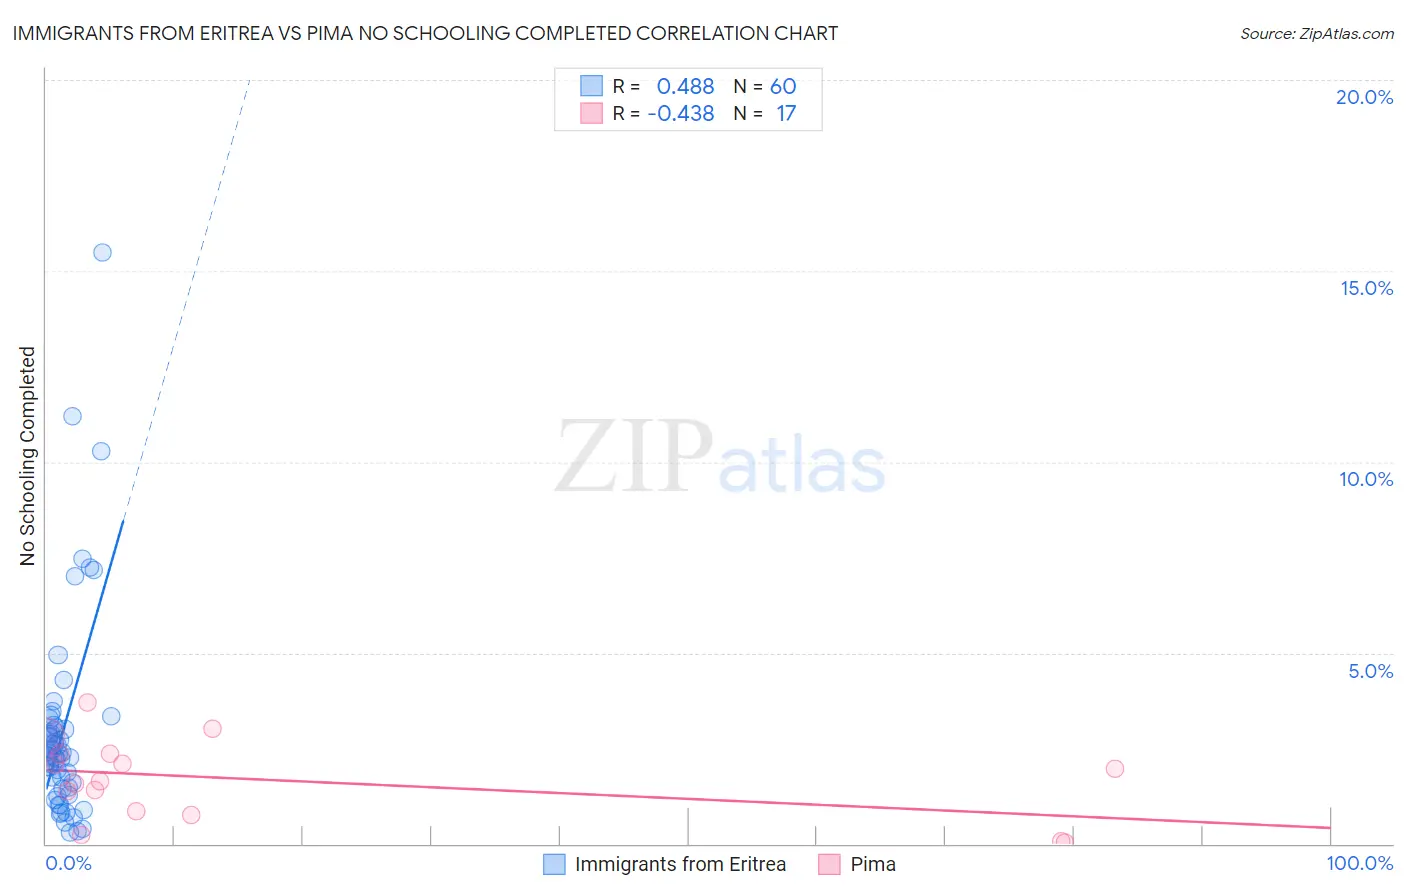
Immigrants from Eritrea vs Pima No Schooling Completed Correlation Chart
The statistical analysis conducted on geographies consisting of 104,735,376 people shows a moderate positive correlation between the proportion of Immigrants from Eritrea and percentage of population with no schooling in the United States with a correlation coefficient (R) of 0.488 and weighted average of 2.8%. Similarly, the statistical analysis conducted on geographies consisting of 61,416,926 people shows a moderate negative correlation between the proportion of Pima and percentage of population with no schooling in the United States with a correlation coefficient (R) of -0.438 and weighted average of 2.1%, a difference of 31.0%.
No Schooling Completed Correlation Summary
| Measurement | Immigrants from Eritrea | Pima |
| Minimum | 0.30% | 0.035% |
| Maximum | 15.5% | 3.7% |
| Range | 15.2% | 3.7% |
| Mean | 3.0% | 1.7% |
| Median | 2.3% | 1.6% |
| Interquartile 25% (IQ1) | 1.4% | 0.80% |
| Interquartile 75% (IQ3) | 3.1% | 2.3% |
| Interquartile Range (IQR) | 1.6% | 1.5% |
| Standard Deviation (Sample) | 2.7% | 1.0% |
| Standard Deviation (Population) | 2.7% | 1.0% |
Similar Demographics by No Schooling Completed
Demographics Similar to Immigrants from Eritrea by No Schooling Completed
In terms of no schooling completed, the demographic groups most similar to Immigrants from Eritrea are Malaysian (2.8%, a difference of 0.17%), Houma (2.8%, a difference of 0.52%), Immigrants from Grenada (2.8%, a difference of 0.58%), Immigrants (2.8%, a difference of 0.62%), and British West Indian (2.7%, a difference of 1.6%).
| Demographics | Rating | Rank | No Schooling Completed |
| Immigrants | Afghanistan | 0.0 /100 | #287 | Tragic 2.7% |
| Immigrants | St. Vincent and the Grenadines | 0.0 /100 | #288 | Tragic 2.7% |
| Immigrants | Thailand | 0.0 /100 | #289 | Tragic 2.7% |
| Immigrants | Hong Kong | 0.0 /100 | #290 | Tragic 2.7% |
| British West Indians | 0.0 /100 | #291 | Tragic 2.7% |
| Immigrants | Grenada | 0.0 /100 | #292 | Tragic 2.8% |
| Malaysians | 0.0 /100 | #293 | Tragic 2.8% |
| Immigrants | Eritrea | 0.0 /100 | #294 | Tragic 2.8% |
| Houma | 0.0 /100 | #295 | Tragic 2.8% |
| Immigrants | Immigrants | 0.0 /100 | #296 | Tragic 2.8% |
| Immigrants | Cuba | 0.0 /100 | #297 | Tragic 2.8% |
| Immigrants | Dominica | 0.0 /100 | #298 | Tragic 2.8% |
| Central American Indians | 0.0 /100 | #299 | Tragic 2.8% |
| Haitians | 0.0 /100 | #300 | Tragic 2.9% |
| Immigrants | South Eastern Asia | 0.0 /100 | #301 | Tragic 2.9% |
Demographics Similar to Pima by No Schooling Completed
In terms of no schooling completed, the demographic groups most similar to Pima are Black/African American (2.1%, a difference of 0.020%), Mongolian (2.1%, a difference of 0.070%), French American Indian (2.1%, a difference of 0.12%), Immigrants from Taiwan (2.1%, a difference of 0.17%), and Portuguese (2.1%, a difference of 0.35%).
| Demographics | Rating | Rank | No Schooling Completed |
| Arapaho | 45.0 /100 | #177 | Average 2.1% |
| Pakistanis | 44.7 /100 | #178 | Average 2.1% |
| Immigrants | Kazakhstan | 44.3 /100 | #179 | Average 2.1% |
| Portuguese | 43.9 /100 | #180 | Average 2.1% |
| Immigrants | Taiwan | 42.6 /100 | #181 | Average 2.1% |
| French American Indians | 42.2 /100 | #182 | Average 2.1% |
| Blacks/African Americans | 41.4 /100 | #183 | Average 2.1% |
| Pima | 41.3 /100 | #184 | Average 2.1% |
| Mongolians | 40.8 /100 | #185 | Average 2.1% |
| Immigrants | Bosnia and Herzegovina | 38.6 /100 | #186 | Fair 2.1% |
| Navajo | 36.5 /100 | #187 | Fair 2.1% |
| Immigrants | Kenya | 36.2 /100 | #188 | Fair 2.1% |
| Immigrants | Egypt | 36.1 /100 | #189 | Fair 2.1% |
| Spanish Americans | 32.6 /100 | #190 | Fair 2.1% |
| Bermudans | 30.7 /100 | #191 | Fair 2.1% |