Venezuelan vs Immigrants from Ghana Professional Degree

COMPARE

Venezuelan
Race
Ancestry
AfghanAfricanAlaska NativeAlaskan AthabascanAlbanianAleutAlsatianAmericanApacheArabArapahoArgentineanArmenianAssyrian/Chaldean/SyriacAustralianAustrianBahamianBangladeshiBarbadianBasqueBelgianBelizeanBermudanBhutaneseBlackfeetBolivianBrazilianBritishBritish West IndianBulgarianBurmeseCajunCambodianCanadianCape VerdeanCarpatho RusynCelticCentral AmericanCentral American IndianCherokeeCheyenneChickasawChileanChineseChippewaChoctawColombianColvilleComancheCosta RicanCreeCreekCroatianCrowCubanCypriotCzechCzechoslovakianDanishDelawareDominicanDutchDutch West IndianEastern EuropeanEcuadorianEgyptianEnglishEstonianEthiopianEuropeanFijianFilipinoFinnishFrenchFrench American IndianFrench CanadianGermanGerman RussianGhanaianGreekGuamanian/ChamorroGuatemalanGuyaneseHaitianHmongHonduranHopiHoumaHungarianIcelanderIndian (Asian)IndonesianInupiatIranianIraqiIrishIroquoisIsraeliItalianJamaicanJapaneseJordanianKenyanKiowaKoreanLaotianLatvianLebaneseLiberianLithuanianLumbeeLuxembourgerMacedonianMalaysianMalteseMarshalleseMenomineeMexicanMexican American IndianMongolianMoroccanNative HawaiianNavajoNepaleseNew ZealanderNicaraguanNigerianNorthern EuropeanNorwegianOkinawanOsageOttawaPaiutePakistaniPalestinianPanamanianParaguayanPennsylvania GermanPeruvianPimaPolishPortuguesePotawatomiPuebloPuerto RicanPuget Sound SalishRomanianRussianSalvadoranSamoanScandinavianScotch-IrishScottishSeminoleSenegaleseSerbianShoshoneSierra LeoneanSiouxSlavicSlovakSloveneSomaliSouth AfricanSouth AmericanSouth American IndianSoviet UnionSpaniardSpanishSpanish AmericanSpanish American IndianSri LankanSubsaharan AfricanSudaneseSwedishSwissSyrianTaiwaneseThaiTlingit-HaidaTohono O'OdhamTonganTrinidadian and TobagonianTsimshianTurkishU.S. Virgin IslanderUgandanUkrainianUruguayanUteVenezuelanVietnameseWelshWest IndianYakamaYaquiYugoslavianYumanYup'ikZimbabwean
Immigration
NonimmigrantsImmigrantsAfghanistanAfricaAlbaniaArgentinaArmeniaAsiaAustraliaAustriaBahamasBangladeshBarbadosBelarusBelgiumBelizeBoliviaBosnia and HerzegovinaBrazilBulgariaBurma/MyanmarCabo VerdeCambodiaCameroonCanadaCaribbeanCentral AmericaChileChinaColombiaCongoCosta RicaCroatiaCubaCzechoslovakiaDenmarkDominicaDominican RepublicEastern AfricaEastern AsiaEastern EuropeEcuadorEgyptEl SalvadorEnglandEritreaEthiopiaEuropeFijiFranceGermanyGreeceGrenadaGuatemalaGuyanaHaitiHondurasHong KongHungaryIndiaIndonesiaIranIraqIrelandIsraelItalyJamaicaJapanJordanKazakhstanKenyaKoreaKuwaitLaosLatin AmericaLatviaLebanonLiberiaLithuaniaMalaysiaMexicoMicronesiaMiddle AfricaMoldovaMoroccoNepalNetherlandsNicaraguaNigeriaNorth AmericaNorth MacedoniaNorthern AfricaNorthern EuropeNorwayOceaniaPakistanPanamaPeruPhilippinesPolandPortugalRomaniaRussiaSaudi ArabiaScotlandSenegalSerbiaSierra LeoneSingaporeSomaliaSouth AfricaSouth AmericaSouth Central AsiaSouth Eastern AsiaSouthern EuropeSpainSri LankaSt. Vincent and the GrenadinesSudanSwedenSwitzerlandSyriaTaiwanThailandTrinidad and TobagoTurkeyUgandaUkraineUruguayUzbekistanVenezuelaVietnamWest IndiesWestern AfricaWestern AsiaWestern EuropeYemenZaireZimbabweAzores
Immigrants from Ghana
Race
Ancestry
AfghanAfricanAlaska NativeAlaskan AthabascanAlbanianAleutAlsatianAmericanApacheArabArapahoArgentineanArmenianAssyrian/Chaldean/SyriacAustralianAustrianBahamianBangladeshiBarbadianBasqueBelgianBelizeanBermudanBhutaneseBlackfeetBolivianBrazilianBritishBritish West IndianBulgarianBurmeseCajunCambodianCanadianCape VerdeanCarpatho RusynCelticCentral AmericanCentral American IndianCherokeeCheyenneChickasawChileanChineseChippewaChoctawColombianColvilleComancheCosta RicanCreeCreekCroatianCrowCubanCypriotCzechCzechoslovakianDanishDelawareDominicanDutchDutch West IndianEastern EuropeanEcuadorianEgyptianEnglishEstonianEthiopianEuropeanFijianFilipinoFinnishFrenchFrench American IndianFrench CanadianGermanGerman RussianGhanaianGreekGuamanian/ChamorroGuatemalanGuyaneseHaitianHmongHonduranHopiHoumaHungarianIcelanderIndian (Asian)IndonesianInupiatIranianIraqiIrishIroquoisIsraeliItalianJamaicanJapaneseJordanianKenyanKiowaKoreanLaotianLatvianLebaneseLiberianLithuanianLumbeeLuxembourgerMacedonianMalaysianMalteseMarshalleseMenomineeMexicanMexican American IndianMongolianMoroccanNative HawaiianNavajoNepaleseNew ZealanderNicaraguanNigerianNorthern EuropeanNorwegianOkinawanOsageOttawaPaiutePakistaniPalestinianPanamanianParaguayanPennsylvania GermanPeruvianPimaPolishPortuguesePotawatomiPuebloPuerto RicanPuget Sound SalishRomanianRussianSalvadoranSamoanScandinavianScotch-IrishScottishSeminoleSenegaleseSerbianShoshoneSierra LeoneanSiouxSlavicSlovakSloveneSomaliSouth AfricanSouth AmericanSouth American IndianSoviet UnionSpaniardSpanishSpanish AmericanSpanish American IndianSri LankanSubsaharan AfricanSudaneseSwedishSwissSyrianTaiwaneseThaiTlingit-HaidaTohono O'OdhamTonganTrinidadian and TobagonianTsimshianTurkishU.S. Virgin IslanderUgandanUkrainianUruguayanUteVietnameseWelshWest IndianYakamaYaquiYugoslavianYumanYup'ikZimbabwean
Immigration
NonimmigrantsImmigrantsAfghanistanAfricaAlbaniaArgentinaArmeniaAsiaAustraliaAustriaBahamasBangladeshBarbadosBelarusBelgiumBelizeBoliviaBosnia and HerzegovinaBrazilBulgariaBurma/MyanmarCabo VerdeCambodiaCameroonCanadaCaribbeanCentral AmericaChileChinaColombiaCongoCosta RicaCroatiaCubaCzechoslovakiaDenmarkDominicaDominican RepublicEastern AfricaEastern AsiaEastern EuropeEcuadorEgyptEl SalvadorEnglandEritreaEthiopiaEuropeFijiFranceGermanyGhanaGreeceGrenadaGuatemalaGuyanaHaitiHondurasHong KongHungaryIndiaIndonesiaIranIraqIrelandIsraelItalyJamaicaJapanJordanKazakhstanKenyaKoreaKuwaitLaosLatin AmericaLatviaLebanonLiberiaLithuaniaMalaysiaMexicoMicronesiaMiddle AfricaMoldovaMoroccoNepalNetherlandsNicaraguaNigeriaNorth AmericaNorth MacedoniaNorthern AfricaNorthern EuropeNorwayOceaniaPakistanPanamaPeruPhilippinesPolandPortugalRomaniaRussiaSaudi ArabiaScotlandSenegalSerbiaSierra LeoneSingaporeSomaliaSouth AfricaSouth AmericaSouth Central AsiaSouth Eastern AsiaSouthern EuropeSpainSri LankaSt. Vincent and the GrenadinesSudanSwedenSwitzerlandSyriaTaiwanThailandTrinidad and TobagoTurkeyUgandaUkraineUruguayUzbekistanVenezuelaVietnamWest IndiesWestern AfricaWestern AsiaWestern EuropeYemenZaireZimbabweAzores
Professional Degree
Income
Poverty
Unemployment
Labor Participation
Family Structure
Vehicle Availability
Education Level
Disability

Professional Degree Comparison

Venezuelans

Immigrants from Ghana

Exceptional
Poor
4.9%
PROFESSIONAL DEGREE
96.3/ 100
METRIC RATING
116th/ 347
METRIC RANK
4.1%
PROFESSIONAL DEGREE
10.6/ 100
METRIC RATING
214th/ 347
METRIC RANK

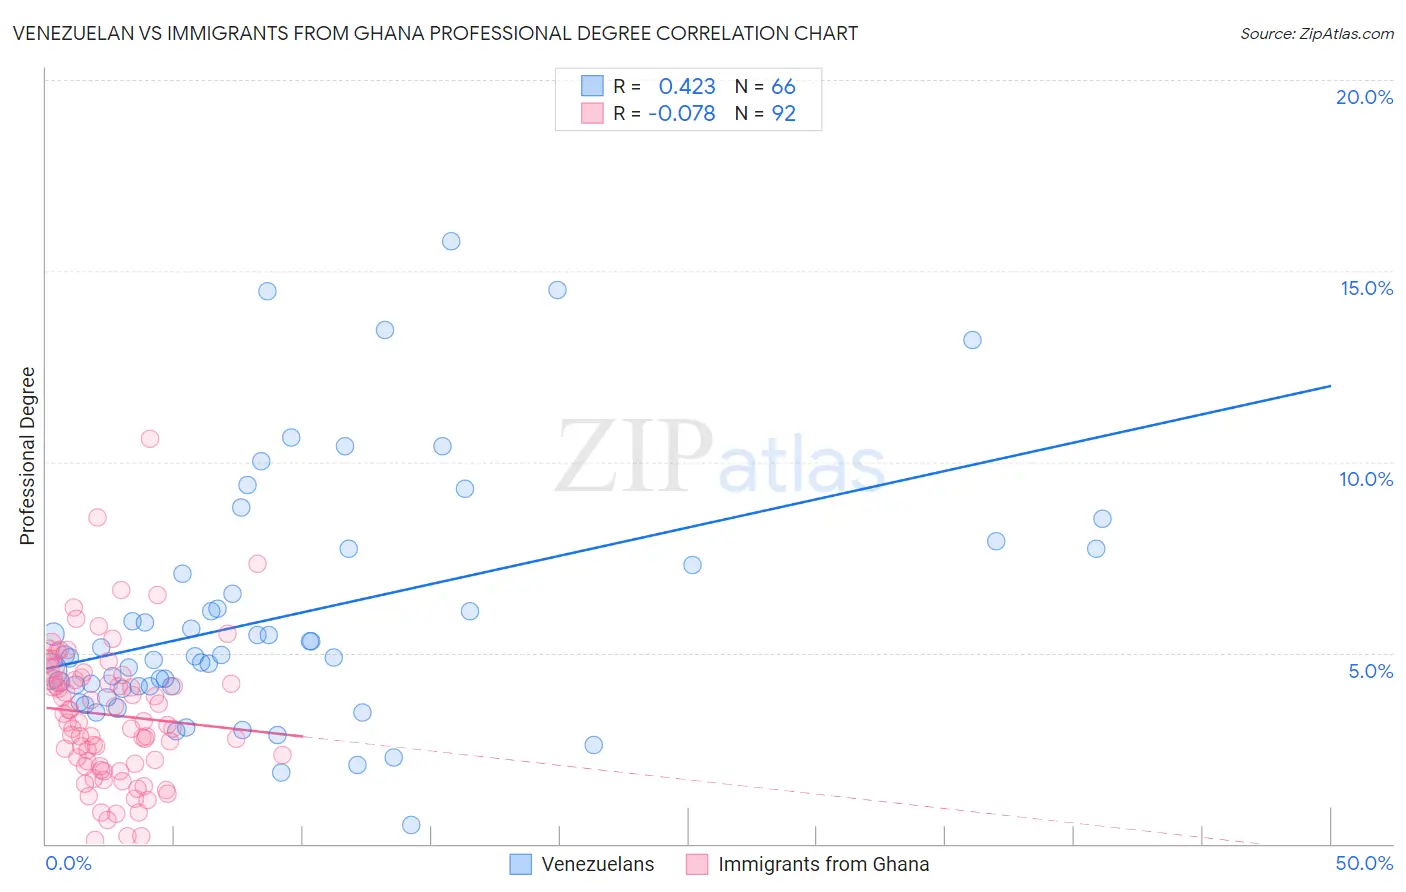
Venezuelan vs Immigrants from Ghana Professional Degree Correlation Chart

The statistical analysis conducted on geographies consisting of 305,937,617 people shows a moderate positive correlation between the proportion of Venezuelans and percentage of population with at least professional degree education in the United States with a correlation coefficient (R) of 0.423 and weighted average of 4.9%. Similarly, the statistical analysis conducted on geographies consisting of 199,711,542 people shows a slight negative correlation between the proportion of Immigrants from Ghana and percentage of population with at least professional degree education in the United States with a correlation coefficient (R) of -0.078 and weighted average of 4.1%, a difference of 21.2%.
Venezuelan vs Immigrants from Ghana Professional Degree

Professional Degree Correlation Summary

MeasurementVenezuelanImmigrants from Ghana
Minimum0.50%0.098%
Maximum15.8%10.6%
Range15.3%10.5%
Mean6.0%3.4%
Median4.9%3.2%
Interquartile 25% (IQ1)4.1%2.1%
Interquartile 75% (IQ3)7.3%4.3%
Interquartile Range (IQR)3.2%2.3%
Standard Deviation (Sample)3.2%1.8%
Standard Deviation (Population)3.2%1.8%

Similar Demographics by Professional Degree

Demographics Similar to Venezuelans by Professional Degree

In terms of professional degree, the demographic groups most similar to Venezuelans are Immigrants from Syria (4.9%, a difference of 0.21%), Croatian (4.9%, a difference of 0.21%), Moroccan (5.0%, a difference of 0.47%), Immigrants from Morocco (5.0%, a difference of 0.57%), and Immigrants from Sudan (4.9%, a difference of 0.75%).
DemographicsRating | RankProfessional Degree
British
98.0
/100
|
#109
Exceptional
5.0%
Lebanese
98.0
/100
|
#110
Exceptional
5.0%
Brazilians
97.4
/100
|
#111
Exceptional
5.0%
Taiwanese
97.3
/100
|
#112
Exceptional
5.0%
Immigrants | Pakistan
97.2
/100
|
#113
Exceptional
5.0%
Immigrants | Morocco
96.8
/100
|
#114
Exceptional
5.0%
Moroccans
96.8
/100
|
#115
Exceptional
5.0%
Venezuelans
96.3
/100
|
#116
Exceptional
4.9%
Immigrants | Syria
96.0
/100
|
#117
Exceptional
4.9%
Croatians
96.0
/100
|
#118
Exceptional
4.9%
Immigrants | Sudan
95.4
/100
|
#119
Exceptional
4.9%
Albanians
95.3
/100
|
#120
Exceptional
4.9%
Immigrants | Moldova
94.8
/100
|
#121
Exceptional
4.9%
Immigrants | Germany
94.1
/100
|
#122
Exceptional
4.9%
Immigrants | Venezuela
93.8
/100
|
#123
Exceptional
4.8%

Demographics Similar to Immigrants from Ghana by Professional Degree

In terms of professional degree, the demographic groups most similar to Immigrants from Ghana are Korean (4.1%, a difference of 0.050%), Portuguese (4.1%, a difference of 0.050%), White/Caucasian (4.1%, a difference of 0.23%), West Indian (4.1%, a difference of 0.37%), and German (4.1%, a difference of 0.41%).
DemographicsRating | RankProfessional Degree
Sub-Saharan Africans
12.8
/100
|
#207
Poor
4.1%
Immigrants | Somalia
12.5
/100
|
#208
Poor
4.1%
Immigrants | Panama
12.3
/100
|
#209
Poor
4.1%
Immigrants | Nigeria
11.7
/100
|
#210
Poor
4.1%
Germans
11.6
/100
|
#211
Poor
4.1%
Whites/Caucasians
11.2
/100
|
#212
Poor
4.1%
Koreans
10.7
/100
|
#213
Poor
4.1%
Immigrants | Ghana
10.6
/100
|
#214
Poor
4.1%
Portuguese
10.5
/100
|
#215
Poor
4.1%
West Indians
9.8
/100
|
#216
Tragic
4.1%
Immigrants | Vietnam
9.4
/100
|
#217
Tragic
4.0%
Dutch
9.0
/100
|
#218
Tragic
4.0%
Immigrants | South Eastern Asia
8.9
/100
|
#219
Tragic
4.0%
Ute
8.2
/100
|
#220
Tragic
4.0%
French Canadians
8.0
/100
|
#221
Tragic
4.0%