Ugandan vs Shoshone No Schooling Completed
COMPARE
Ugandan
Shoshone
No Schooling Completed
No Schooling Completed Comparison
Ugandans
Shoshone
2.0%
NO SCHOOLING COMPLETED
64.6/ 100
METRIC RATING
161st/ 347
METRIC RANK
2.0%
NO SCHOOLING COMPLETED
76.7/ 100
METRIC RATING
148th/ 347
METRIC RANK
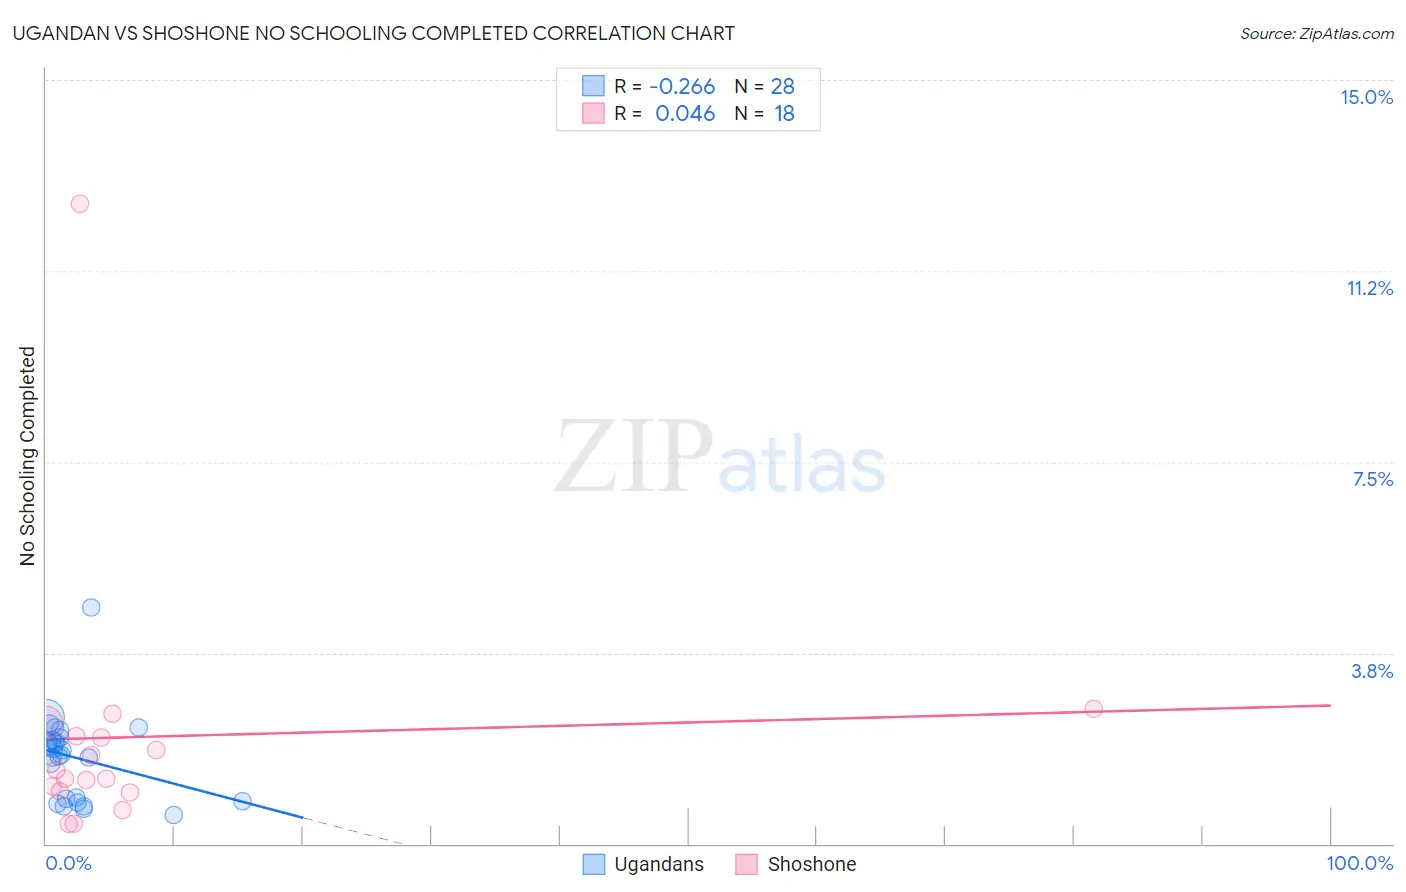
Ugandan vs Shoshone No Schooling Completed Correlation Chart
The statistical analysis conducted on geographies consisting of 93,762,117 people shows a weak negative correlation between the proportion of Ugandans and percentage of population with no schooling in the United States with a correlation coefficient (R) of -0.266 and weighted average of 2.0%. Similarly, the statistical analysis conducted on geographies consisting of 66,330,496 people shows no correlation between the proportion of Shoshone and percentage of population with no schooling in the United States with a correlation coefficient (R) of 0.046 and weighted average of 2.0%, a difference of 2.1%.
No Schooling Completed Correlation Summary
| Measurement | Ugandan | Shoshone |
| Minimum | 0.56% | 0.39% |
| Maximum | 4.6% | 12.6% |
| Range | 4.1% | 12.2% |
| Mean | 1.7% | 2.1% |
| Median | 1.8% | 1.4% |
| Interquartile 25% (IQ1) | 0.85% | 1.0% |
| Interquartile 75% (IQ3) | 2.1% | 2.1% |
| Interquartile Range (IQR) | 1.2% | 1.1% |
| Standard Deviation (Sample) | 0.84% | 2.7% |
| Standard Deviation (Population) | 0.83% | 2.6% |
Demographics Similar to Ugandans and Shoshone by No Schooling Completed
In terms of no schooling completed, the demographic groups most similar to Ugandans are Immigrants from Brazil (2.1%, a difference of 0.11%), Kenyan (2.0%, a difference of 0.17%), Immigrants from Spain (2.0%, a difference of 0.29%), Immigrants from Korea (2.0%, a difference of 0.33%), and Albanian (2.1%, a difference of 0.35%). Similarly, the demographic groups most similar to Shoshone are Soviet Union (2.0%, a difference of 0.080%), Immigrants from North Macedonia (2.0%, a difference of 0.15%), Immigrants from Moldova (2.0%, a difference of 0.26%), Immigrants from Iran (2.0%, a difference of 0.47%), and Alsatian (2.0%, a difference of 0.48%).
| Demographics | Rating | Rank | No Schooling Completed |
| Alsatians | 79.1 /100 | #144 | Good 2.0% |
| Immigrants | Iran | 79.0 /100 | #145 | Good 2.0% |
| Immigrants | Moldova | 78.0 /100 | #146 | Good 2.0% |
| Soviet Union | 77.1 /100 | #147 | Good 2.0% |
| Shoshone | 76.7 /100 | #148 | Good 2.0% |
| Immigrants | North Macedonia | 75.9 /100 | #149 | Good 2.0% |
| Blackfeet | 72.9 /100 | #150 | Good 2.0% |
| Immigrants | Jordan | 70.9 /100 | #151 | Good 2.0% |
| Immigrants | Eastern Europe | 70.4 /100 | #152 | Good 2.0% |
| Immigrants | Italy | 68.9 /100 | #153 | Good 2.0% |
| Immigrants | Venezuela | 68.5 /100 | #154 | Good 2.0% |
| Immigrants | Russia | 67.6 /100 | #155 | Good 2.0% |
| Chileans | 67.2 /100 | #156 | Good 2.0% |
| Immigrants | Sri Lanka | 67.0 /100 | #157 | Good 2.0% |
| Immigrants | Korea | 66.7 /100 | #158 | Good 2.0% |
| Immigrants | Spain | 66.4 /100 | #159 | Good 2.0% |
| Kenyans | 65.7 /100 | #160 | Good 2.0% |
| Ugandans | 64.6 /100 | #161 | Good 2.0% |
| Immigrants | Brazil | 63.8 /100 | #162 | Good 2.1% |
| Albanians | 62.2 /100 | #163 | Good 2.1% |
| Comanche | 60.7 /100 | #164 | Good 2.1% |