Ute vs Immigrants from Kazakhstan Bachelor's Degree
COMPARE
Ute
Immigrants from Kazakhstan
Bachelor's Degree
Bachelor's Degree Comparison
Ute
Immigrants from Kazakhstan
30.9%
BACHELOR'S DEGREE
0.1/ 100
METRIC RATING
292nd/ 347
METRIC RANK
43.4%
BACHELOR'S DEGREE
99.8/ 100
METRIC RATING
62nd/ 347
METRIC RANK
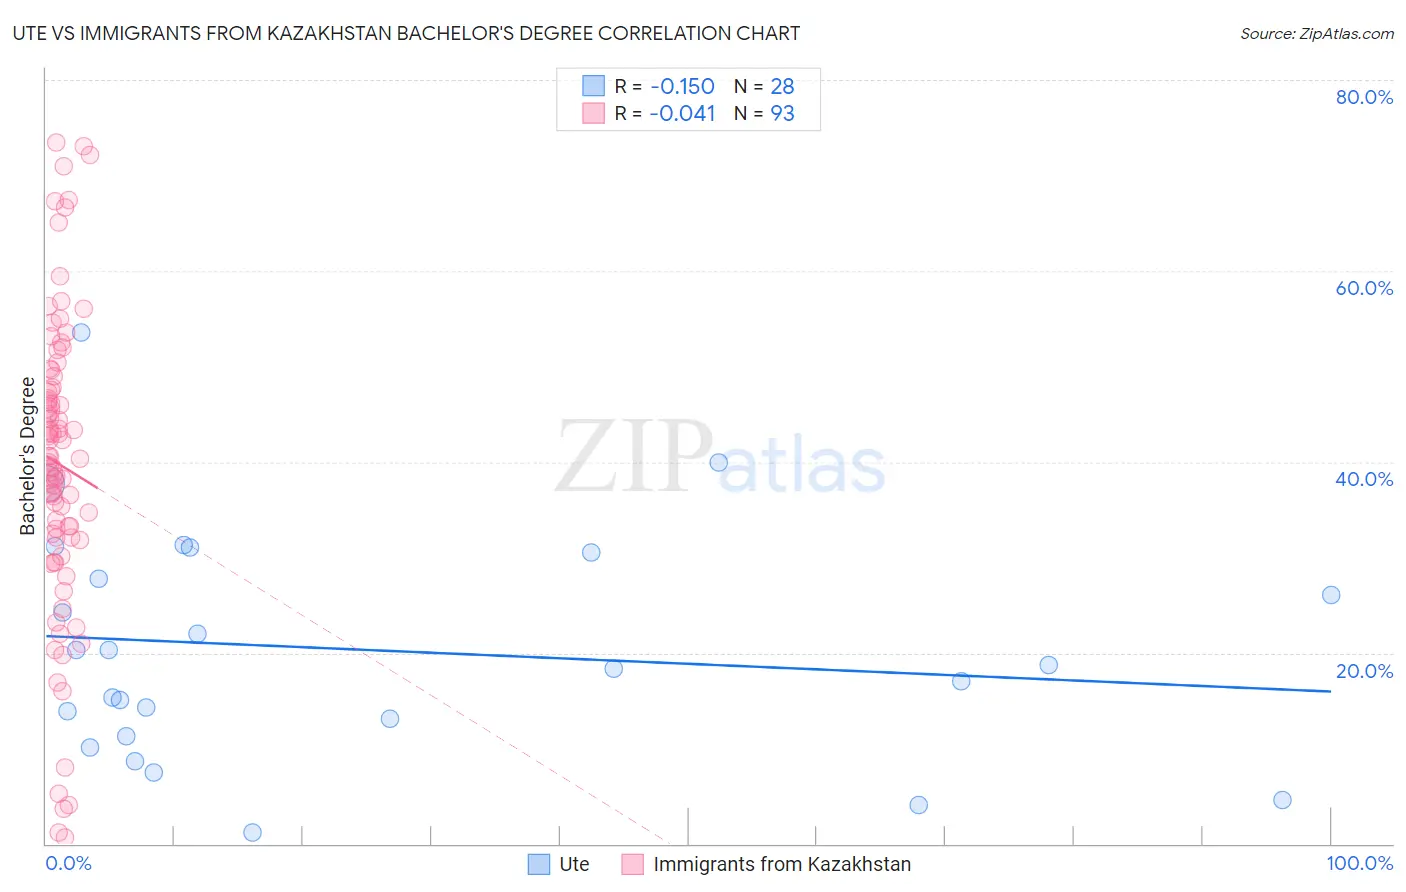
Ute vs Immigrants from Kazakhstan Bachelor's Degree Correlation Chart
The statistical analysis conducted on geographies consisting of 55,667,997 people shows a poor negative correlation between the proportion of Ute and percentage of population with at least bachelor's degree education in the United States with a correlation coefficient (R) of -0.150 and weighted average of 30.9%. Similarly, the statistical analysis conducted on geographies consisting of 124,444,388 people shows no correlation between the proportion of Immigrants from Kazakhstan and percentage of population with at least bachelor's degree education in the United States with a correlation coefficient (R) of -0.041 and weighted average of 43.4%, a difference of 40.5%.
Bachelor's Degree Correlation Summary
| Measurement | Ute | Immigrants from Kazakhstan |
| Minimum | 1.2% | 0.64% |
| Maximum | 53.5% | 73.4% |
| Range | 52.3% | 72.8% |
| Mean | 20.3% | 39.8% |
| Median | 18.6% | 40.4% |
| Interquartile 25% (IQ1) | 12.2% | 32.1% |
| Interquartile 75% (IQ3) | 29.1% | 48.4% |
| Interquartile Range (IQR) | 16.9% | 16.4% |
| Standard Deviation (Sample) | 12.1% | 15.8% |
| Standard Deviation (Population) | 11.8% | 15.7% |
Similar Demographics by Bachelor's Degree
Demographics Similar to Ute by Bachelor's Degree
In terms of bachelor's degree, the demographic groups most similar to Ute are Black/African American (30.9%, a difference of 0.080%), Cape Verdean (30.9%, a difference of 0.090%), Immigrants from Honduras (30.9%, a difference of 0.12%), Puerto Rican (31.0%, a difference of 0.16%), and Guatemalan (31.0%, a difference of 0.30%).
| Demographics | Rating | Rank | Bachelor's Degree |
| Aleuts | 0.1 /100 | #285 | Tragic 31.3% |
| Immigrants | El Salvador | 0.1 /100 | #286 | Tragic 31.3% |
| Ottawa | 0.1 /100 | #287 | Tragic 31.1% |
| Guatemalans | 0.1 /100 | #288 | Tragic 31.0% |
| Puerto Ricans | 0.1 /100 | #289 | Tragic 31.0% |
| Immigrants | Honduras | 0.1 /100 | #290 | Tragic 30.9% |
| Blacks/African Americans | 0.1 /100 | #291 | Tragic 30.9% |
| Ute | 0.1 /100 | #292 | Tragic 30.9% |
| Cape Verdeans | 0.1 /100 | #293 | Tragic 30.9% |
| Immigrants | Guatemala | 0.0 /100 | #294 | Tragic 30.8% |
| Immigrants | Dominican Republic | 0.0 /100 | #295 | Tragic 30.7% |
| Puget Sound Salish | 0.0 /100 | #296 | Tragic 30.7% |
| Immigrants | Haiti | 0.0 /100 | #297 | Tragic 30.6% |
| Chippewa | 0.0 /100 | #298 | Tragic 30.6% |
| Chickasaw | 0.0 /100 | #299 | Tragic 30.4% |
Demographics Similar to Immigrants from Kazakhstan by Bachelor's Degree
In terms of bachelor's degree, the demographic groups most similar to Immigrants from Kazakhstan are Immigrants from Europe (43.4%, a difference of 0.050%), South African (43.6%, a difference of 0.30%), Argentinean (43.3%, a difference of 0.32%), Zimbabwean (43.3%, a difference of 0.32%), and Immigrants from Netherlands (43.3%, a difference of 0.35%).
| Demographics | Rating | Rank | Bachelor's Degree |
| Immigrants | Bolivia | 99.9 /100 | #55 | Exceptional 44.2% |
| Immigrants | Serbia | 99.9 /100 | #56 | Exceptional 44.1% |
| Paraguayans | 99.9 /100 | #57 | Exceptional 44.0% |
| Immigrants | Czechoslovakia | 99.9 /100 | #58 | Exceptional 44.0% |
| Australians | 99.9 /100 | #59 | Exceptional 44.0% |
| New Zealanders | 99.9 /100 | #60 | Exceptional 44.0% |
| South Africans | 99.8 /100 | #61 | Exceptional 43.6% |
| Immigrants | Kazakhstan | 99.8 /100 | #62 | Exceptional 43.4% |
| Immigrants | Europe | 99.8 /100 | #63 | Exceptional 43.4% |
| Argentineans | 99.7 /100 | #64 | Exceptional 43.3% |
| Zimbabweans | 99.7 /100 | #65 | Exceptional 43.3% |
| Immigrants | Netherlands | 99.7 /100 | #66 | Exceptional 43.3% |
| Egyptians | 99.7 /100 | #67 | Exceptional 43.3% |
| Immigrants | Indonesia | 99.7 /100 | #68 | Exceptional 43.3% |
| Immigrants | Pakistan | 99.7 /100 | #69 | Exceptional 43.1% |