Ute vs Immigrants from Nigeria Bachelor's Degree
COMPARE
Ute
Immigrants from Nigeria
Bachelor's Degree
Bachelor's Degree Comparison
Ute
Immigrants from Nigeria
30.9%
BACHELOR'S DEGREE
0.1/ 100
METRIC RATING
292nd/ 347
METRIC RANK
36.7%
BACHELOR'S DEGREE
23.1/ 100
METRIC RATING
203rd/ 347
METRIC RANK
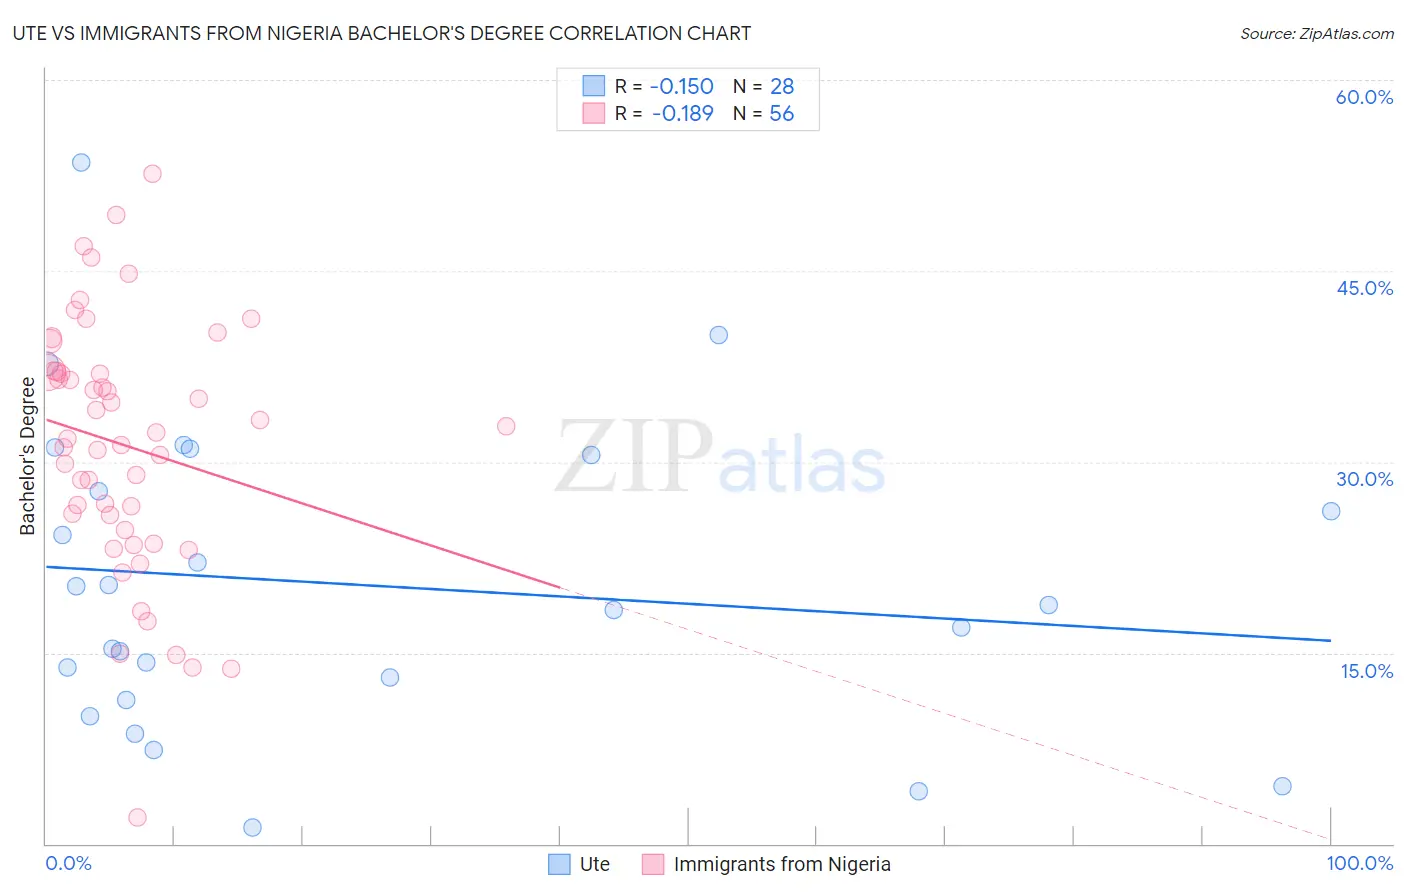
Ute vs Immigrants from Nigeria Bachelor's Degree Correlation Chart
The statistical analysis conducted on geographies consisting of 55,667,997 people shows a poor negative correlation between the proportion of Ute and percentage of population with at least bachelor's degree education in the United States with a correlation coefficient (R) of -0.150 and weighted average of 30.9%. Similarly, the statistical analysis conducted on geographies consisting of 283,462,010 people shows a poor negative correlation between the proportion of Immigrants from Nigeria and percentage of population with at least bachelor's degree education in the United States with a correlation coefficient (R) of -0.189 and weighted average of 36.7%, a difference of 18.8%.
Bachelor's Degree Correlation Summary
| Measurement | Ute | Immigrants from Nigeria |
| Minimum | 1.2% | 2.0% |
| Maximum | 53.5% | 52.6% |
| Range | 52.3% | 50.6% |
| Mean | 20.3% | 31.3% |
| Median | 18.6% | 32.1% |
| Interquartile 25% (IQ1) | 12.2% | 25.2% |
| Interquartile 75% (IQ3) | 29.1% | 37.0% |
| Interquartile Range (IQR) | 16.9% | 11.8% |
| Standard Deviation (Sample) | 12.1% | 9.9% |
| Standard Deviation (Population) | 11.8% | 9.8% |
Similar Demographics by Bachelor's Degree
Demographics Similar to Ute by Bachelor's Degree
In terms of bachelor's degree, the demographic groups most similar to Ute are Black/African American (30.9%, a difference of 0.080%), Cape Verdean (30.9%, a difference of 0.090%), Immigrants from Honduras (30.9%, a difference of 0.12%), Puerto Rican (31.0%, a difference of 0.16%), and Guatemalan (31.0%, a difference of 0.30%).
| Demographics | Rating | Rank | Bachelor's Degree |
| Aleuts | 0.1 /100 | #285 | Tragic 31.3% |
| Immigrants | El Salvador | 0.1 /100 | #286 | Tragic 31.3% |
| Ottawa | 0.1 /100 | #287 | Tragic 31.1% |
| Guatemalans | 0.1 /100 | #288 | Tragic 31.0% |
| Puerto Ricans | 0.1 /100 | #289 | Tragic 31.0% |
| Immigrants | Honduras | 0.1 /100 | #290 | Tragic 30.9% |
| Blacks/African Americans | 0.1 /100 | #291 | Tragic 30.9% |
| Ute | 0.1 /100 | #292 | Tragic 30.9% |
| Cape Verdeans | 0.1 /100 | #293 | Tragic 30.9% |
| Immigrants | Guatemala | 0.0 /100 | #294 | Tragic 30.8% |
| Immigrants | Dominican Republic | 0.0 /100 | #295 | Tragic 30.7% |
| Puget Sound Salish | 0.0 /100 | #296 | Tragic 30.7% |
| Immigrants | Haiti | 0.0 /100 | #297 | Tragic 30.6% |
| Chippewa | 0.0 /100 | #298 | Tragic 30.6% |
| Chickasaw | 0.0 /100 | #299 | Tragic 30.4% |
Demographics Similar to Immigrants from Nigeria by Bachelor's Degree
In terms of bachelor's degree, the demographic groups most similar to Immigrants from Nigeria are Immigrants (36.7%, a difference of 0.040%), Finnish (36.7%, a difference of 0.14%), Spaniard (36.6%, a difference of 0.28%), Immigrants from Zaire (36.8%, a difference of 0.29%), and Immigrants from South Eastern Asia (36.8%, a difference of 0.31%).
| Demographics | Rating | Rank | Bachelor's Degree |
| Celtics | 29.5 /100 | #196 | Fair 37.0% |
| Czechoslovakians | 29.2 /100 | #197 | Fair 37.0% |
| Welsh | 29.1 /100 | #198 | Fair 37.0% |
| Immigrants | Costa Rica | 27.4 /100 | #199 | Fair 36.9% |
| Immigrants | Ghana | 27.4 /100 | #200 | Fair 36.9% |
| Immigrants | South Eastern Asia | 25.4 /100 | #201 | Fair 36.8% |
| Immigrants | Zaire | 25.3 /100 | #202 | Fair 36.8% |
| Immigrants | Nigeria | 23.1 /100 | #203 | Fair 36.7% |
| Immigrants | Immigrants | 22.8 /100 | #204 | Fair 36.7% |
| Finns | 22.2 /100 | #205 | Fair 36.7% |
| Spaniards | 21.2 /100 | #206 | Fair 36.6% |
| Immigrants | Middle Africa | 20.6 /100 | #207 | Fair 36.6% |
| Immigrants | Thailand | 19.4 /100 | #208 | Poor 36.5% |
| Panamanians | 18.8 /100 | #209 | Poor 36.5% |
| French | 18.6 /100 | #210 | Poor 36.5% |