Ute vs Burmese 11th Grade
COMPARE
Ute
Burmese
11th Grade
11th Grade Comparison
Ute
Burmese
91.1%
11TH GRADE
0.2/ 100
METRIC RATING
269th/ 347
METRIC RANK
93.6%
11TH GRADE
99.2/ 100
METRIC RATING
89th/ 347
METRIC RANK
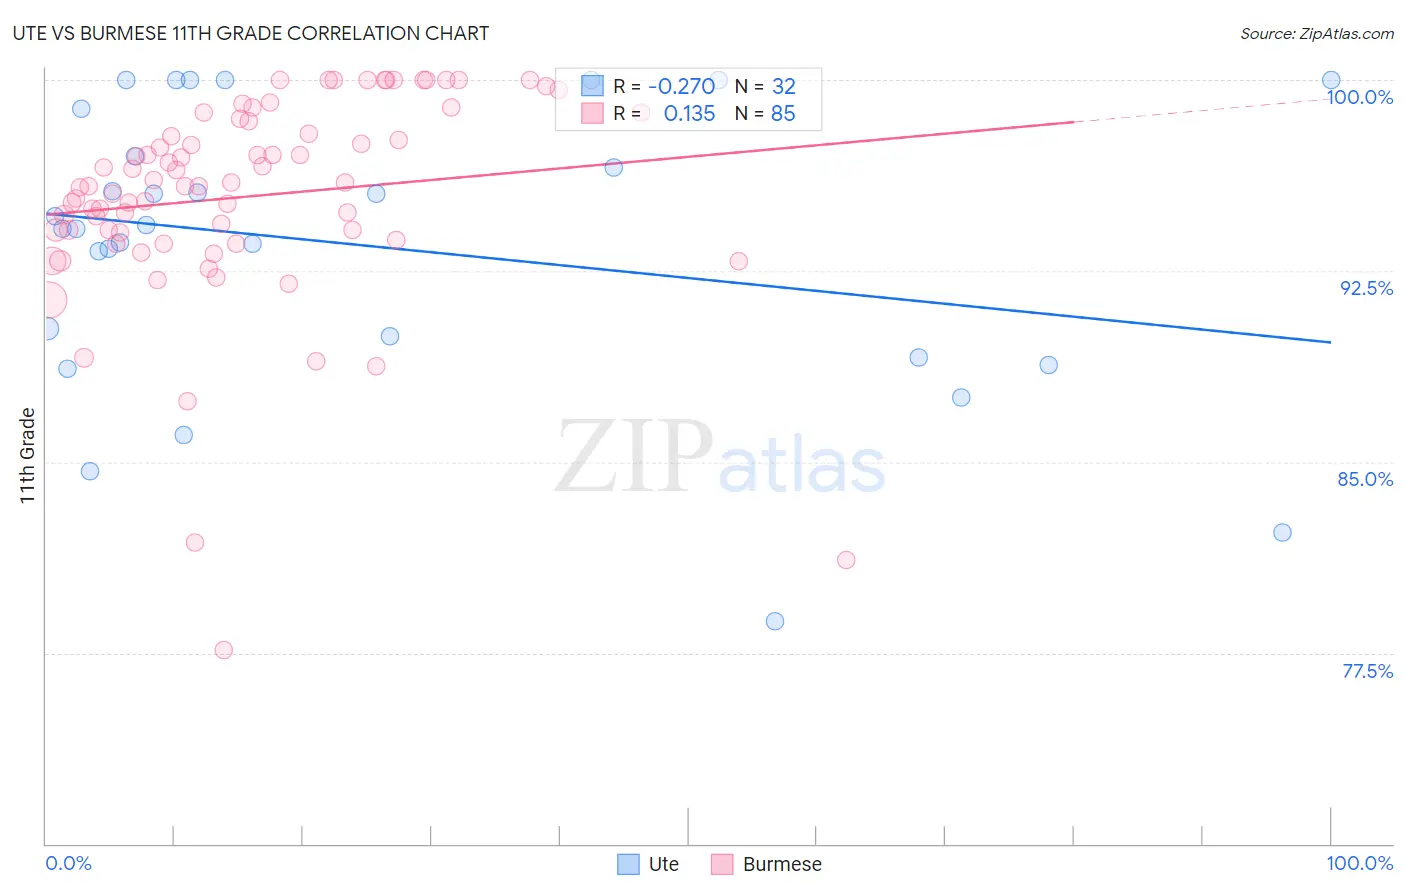
Ute vs Burmese 11th Grade Correlation Chart
The statistical analysis conducted on geographies consisting of 55,668,599 people shows a weak negative correlation between the proportion of Ute and percentage of population with at least 11th grade education in the United States with a correlation coefficient (R) of -0.270 and weighted average of 91.1%. Similarly, the statistical analysis conducted on geographies consisting of 465,370,495 people shows a poor positive correlation between the proportion of Burmese and percentage of population with at least 11th grade education in the United States with a correlation coefficient (R) of 0.135 and weighted average of 93.6%, a difference of 2.8%.
11th Grade Correlation Summary
| Measurement | Ute | Burmese |
| Minimum | 78.7% | 77.6% |
| Maximum | 100.0% | 100.0% |
| Range | 21.3% | 22.4% |
| Mean | 93.5% | 95.4% |
| Median | 94.2% | 95.8% |
| Interquartile 25% (IQ1) | 89.5% | 93.9% |
| Interquartile 75% (IQ3) | 98.0% | 98.4% |
| Interquartile Range (IQR) | 8.4% | 4.6% |
| Standard Deviation (Sample) | 5.6% | 4.1% |
| Standard Deviation (Population) | 5.5% | 4.1% |
Similar Demographics by 11th Grade
Demographics Similar to Ute by 11th Grade
In terms of 11th grade, the demographic groups most similar to Ute are U.S. Virgin Islander (91.1%, a difference of 0.030%), Trinidadian and Tobagonian (91.1%, a difference of 0.030%), Immigrants from Peru (91.0%, a difference of 0.060%), West Indian (91.0%, a difference of 0.060%), and Immigrants from Jamaica (91.2%, a difference of 0.10%).
| Demographics | Rating | Rank | 11th Grade |
| Immigrants | Uruguay | 0.5 /100 | #262 | Tragic 91.3% |
| Immigrants | Ghana | 0.3 /100 | #263 | Tragic 91.2% |
| Yup'ik | 0.3 /100 | #264 | Tragic 91.2% |
| Pueblo | 0.3 /100 | #265 | Tragic 91.2% |
| Immigrants | Western Africa | 0.3 /100 | #266 | Tragic 91.2% |
| Immigrants | Jamaica | 0.3 /100 | #267 | Tragic 91.2% |
| U.S. Virgin Islanders | 0.2 /100 | #268 | Tragic 91.1% |
| Ute | 0.2 /100 | #269 | Tragic 91.1% |
| Trinidadians and Tobagonians | 0.2 /100 | #270 | Tragic 91.1% |
| Immigrants | Peru | 0.1 /100 | #271 | Tragic 91.0% |
| West Indians | 0.1 /100 | #272 | Tragic 91.0% |
| Paiute | 0.1 /100 | #273 | Tragic 91.0% |
| Immigrants | Trinidad and Tobago | 0.1 /100 | #274 | Tragic 90.9% |
| Immigrants | South Eastern Asia | 0.1 /100 | #275 | Tragic 90.9% |
| Bangladeshis | 0.1 /100 | #276 | Tragic 90.9% |
Demographics Similar to Burmese by 11th Grade
In terms of 11th grade, the demographic groups most similar to Burmese are Immigrants from South Central Asia (93.6%, a difference of 0.0%), Immigrants from Western Europe (93.6%, a difference of 0.0%), Cambodian (93.6%, a difference of 0.0%), Immigrants from Switzerland (93.6%, a difference of 0.010%), and Ottawa (93.6%, a difference of 0.010%).
| Demographics | Rating | Rank | 11th Grade |
| Immigrants | Saudi Arabia | 99.3 /100 | #82 | Exceptional 93.7% |
| Icelanders | 99.3 /100 | #83 | Exceptional 93.6% |
| Immigrants | Taiwan | 99.3 /100 | #84 | Exceptional 93.6% |
| Immigrants | Switzerland | 99.3 /100 | #85 | Exceptional 93.6% |
| Immigrants | South Central Asia | 99.2 /100 | #86 | Exceptional 93.6% |
| Immigrants | Western Europe | 99.2 /100 | #87 | Exceptional 93.6% |
| Cambodians | 99.2 /100 | #88 | Exceptional 93.6% |
| Burmese | 99.2 /100 | #89 | Exceptional 93.6% |
| Ottawa | 99.2 /100 | #90 | Exceptional 93.6% |
| South Africans | 99.2 /100 | #91 | Exceptional 93.6% |
| Immigrants | Bulgaria | 99.1 /100 | #92 | Exceptional 93.6% |
| Puget Sound Salish | 99.1 /100 | #93 | Exceptional 93.6% |
| Swiss | 99.0 /100 | #94 | Exceptional 93.6% |
| Immigrants | France | 99.0 /100 | #95 | Exceptional 93.6% |
| Immigrants | Turkey | 98.9 /100 | #96 | Exceptional 93.5% |