Ute vs French American Indian 11th Grade
COMPARE
Ute
French American Indian
11th Grade
11th Grade Comparison
Ute
French American Indians
91.1%
11TH GRADE
0.2/ 100
METRIC RATING
269th/ 347
METRIC RANK
92.3%
11TH GRADE
30.8/ 100
METRIC RATING
191st/ 347
METRIC RANK
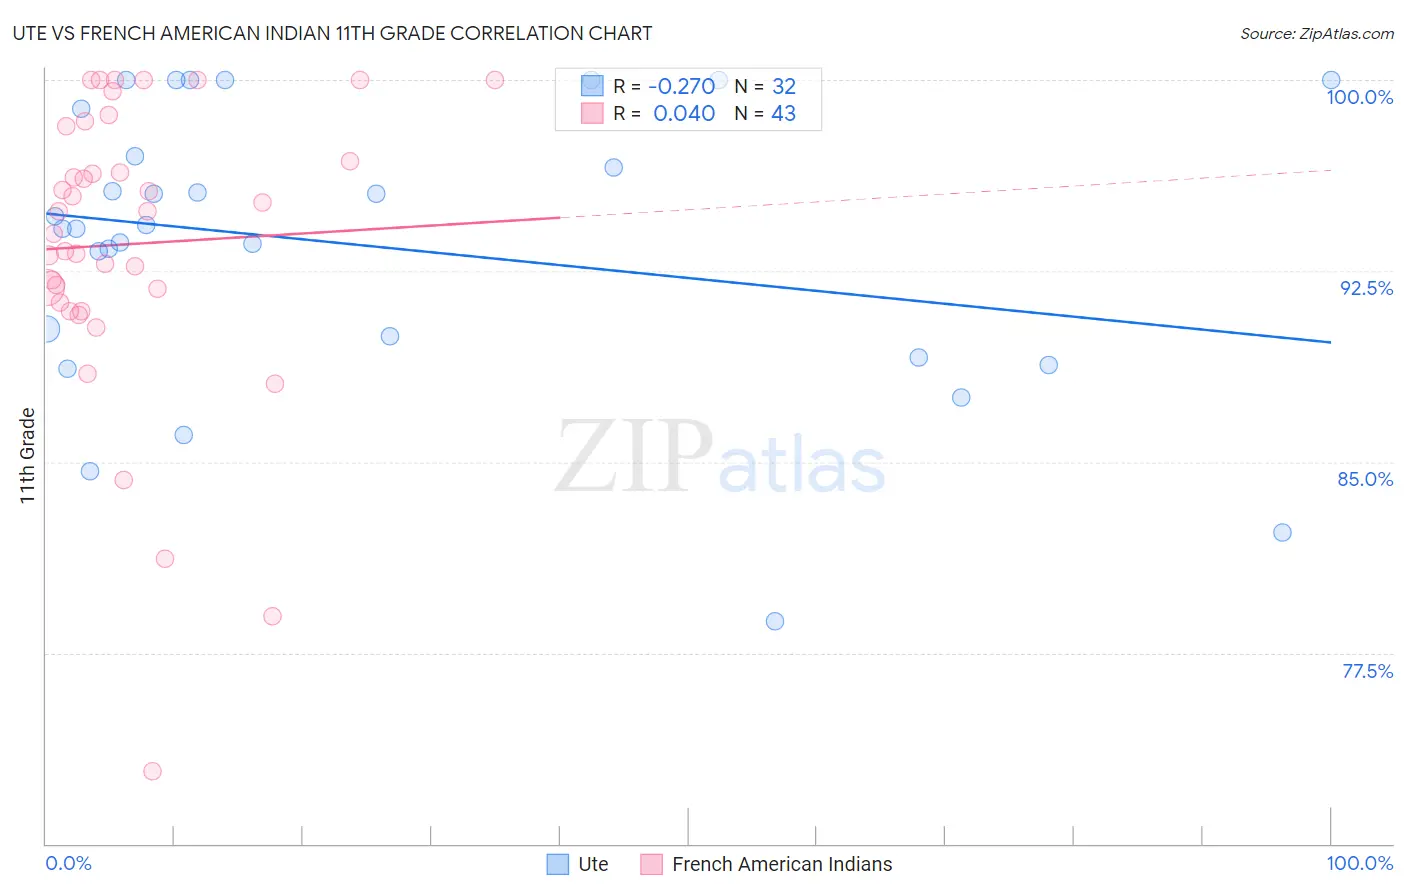
Ute vs French American Indian 11th Grade Correlation Chart
The statistical analysis conducted on geographies consisting of 55,668,599 people shows a weak negative correlation between the proportion of Ute and percentage of population with at least 11th grade education in the United States with a correlation coefficient (R) of -0.270 and weighted average of 91.1%. Similarly, the statistical analysis conducted on geographies consisting of 131,976,269 people shows no correlation between the proportion of French American Indians and percentage of population with at least 11th grade education in the United States with a correlation coefficient (R) of 0.040 and weighted average of 92.3%, a difference of 1.4%.
11th Grade Correlation Summary
| Measurement | Ute | French American Indian |
| Minimum | 78.7% | 72.9% |
| Maximum | 100.0% | 100.0% |
| Range | 21.3% | 27.1% |
| Mean | 93.5% | 93.6% |
| Median | 94.2% | 94.8% |
| Interquartile 25% (IQ1) | 89.5% | 91.3% |
| Interquartile 75% (IQ3) | 98.0% | 98.2% |
| Interquartile Range (IQR) | 8.4% | 6.9% |
| Standard Deviation (Sample) | 5.6% | 5.9% |
| Standard Deviation (Population) | 5.5% | 5.8% |
Similar Demographics by 11th Grade
Demographics Similar to Ute by 11th Grade
In terms of 11th grade, the demographic groups most similar to Ute are U.S. Virgin Islander (91.1%, a difference of 0.030%), Trinidadian and Tobagonian (91.1%, a difference of 0.030%), Immigrants from Peru (91.0%, a difference of 0.060%), West Indian (91.0%, a difference of 0.060%), and Immigrants from Jamaica (91.2%, a difference of 0.10%).
| Demographics | Rating | Rank | 11th Grade |
| Immigrants | Uruguay | 0.5 /100 | #262 | Tragic 91.3% |
| Immigrants | Ghana | 0.3 /100 | #263 | Tragic 91.2% |
| Yup'ik | 0.3 /100 | #264 | Tragic 91.2% |
| Pueblo | 0.3 /100 | #265 | Tragic 91.2% |
| Immigrants | Western Africa | 0.3 /100 | #266 | Tragic 91.2% |
| Immigrants | Jamaica | 0.3 /100 | #267 | Tragic 91.2% |
| U.S. Virgin Islanders | 0.2 /100 | #268 | Tragic 91.1% |
| Ute | 0.2 /100 | #269 | Tragic 91.1% |
| Trinidadians and Tobagonians | 0.2 /100 | #270 | Tragic 91.1% |
| Immigrants | Peru | 0.1 /100 | #271 | Tragic 91.0% |
| West Indians | 0.1 /100 | #272 | Tragic 91.0% |
| Paiute | 0.1 /100 | #273 | Tragic 91.0% |
| Immigrants | Trinidad and Tobago | 0.1 /100 | #274 | Tragic 90.9% |
| Immigrants | South Eastern Asia | 0.1 /100 | #275 | Tragic 90.9% |
| Bangladeshis | 0.1 /100 | #276 | Tragic 90.9% |
Demographics Similar to French American Indians by 11th Grade
In terms of 11th grade, the demographic groups most similar to French American Indians are Immigrants from Syria (92.3%, a difference of 0.0%), Chickasaw (92.3%, a difference of 0.010%), Moroccan (92.3%, a difference of 0.020%), Immigrants from Indonesia (92.4%, a difference of 0.030%), and Immigrants from Chile (92.4%, a difference of 0.030%).
| Demographics | Rating | Rank | 11th Grade |
| Immigrants | Asia | 37.4 /100 | #184 | Fair 92.4% |
| Immigrants | Nepal | 36.4 /100 | #185 | Fair 92.4% |
| Arapaho | 35.1 /100 | #186 | Fair 92.4% |
| Immigrants | Western Asia | 35.0 /100 | #187 | Fair 92.4% |
| Immigrants | Indonesia | 33.7 /100 | #188 | Fair 92.4% |
| Immigrants | Chile | 33.3 /100 | #189 | Fair 92.4% |
| Chickasaw | 31.4 /100 | #190 | Fair 92.3% |
| French American Indians | 30.8 /100 | #191 | Fair 92.3% |
| Immigrants | Syria | 30.4 /100 | #192 | Fair 92.3% |
| Moroccans | 28.7 /100 | #193 | Fair 92.3% |
| Sioux | 28.5 /100 | #194 | Fair 92.3% |
| Liberians | 26.8 /100 | #195 | Fair 92.3% |
| Panamanians | 26.4 /100 | #196 | Fair 92.3% |
| Marshallese | 26.0 /100 | #197 | Fair 92.3% |
| Hawaiians | 25.5 /100 | #198 | Fair 92.3% |