U.S. Virgin Islander vs Immigrants from Turkey Single Father Households
COMPARE
U.S. Virgin Islander
Immigrants from Turkey
Single Father Households
Single Father Households Comparison
U.S. Virgin Islanders
Immigrants from Turkey
2.4%
SINGLE FATHER HOUSEHOLDS
31.8/ 100
METRIC RATING
189th/ 347
METRIC RANK
2.0%
SINGLE FATHER HOUSEHOLDS
100.0/ 100
METRIC RATING
41st/ 347
METRIC RANK
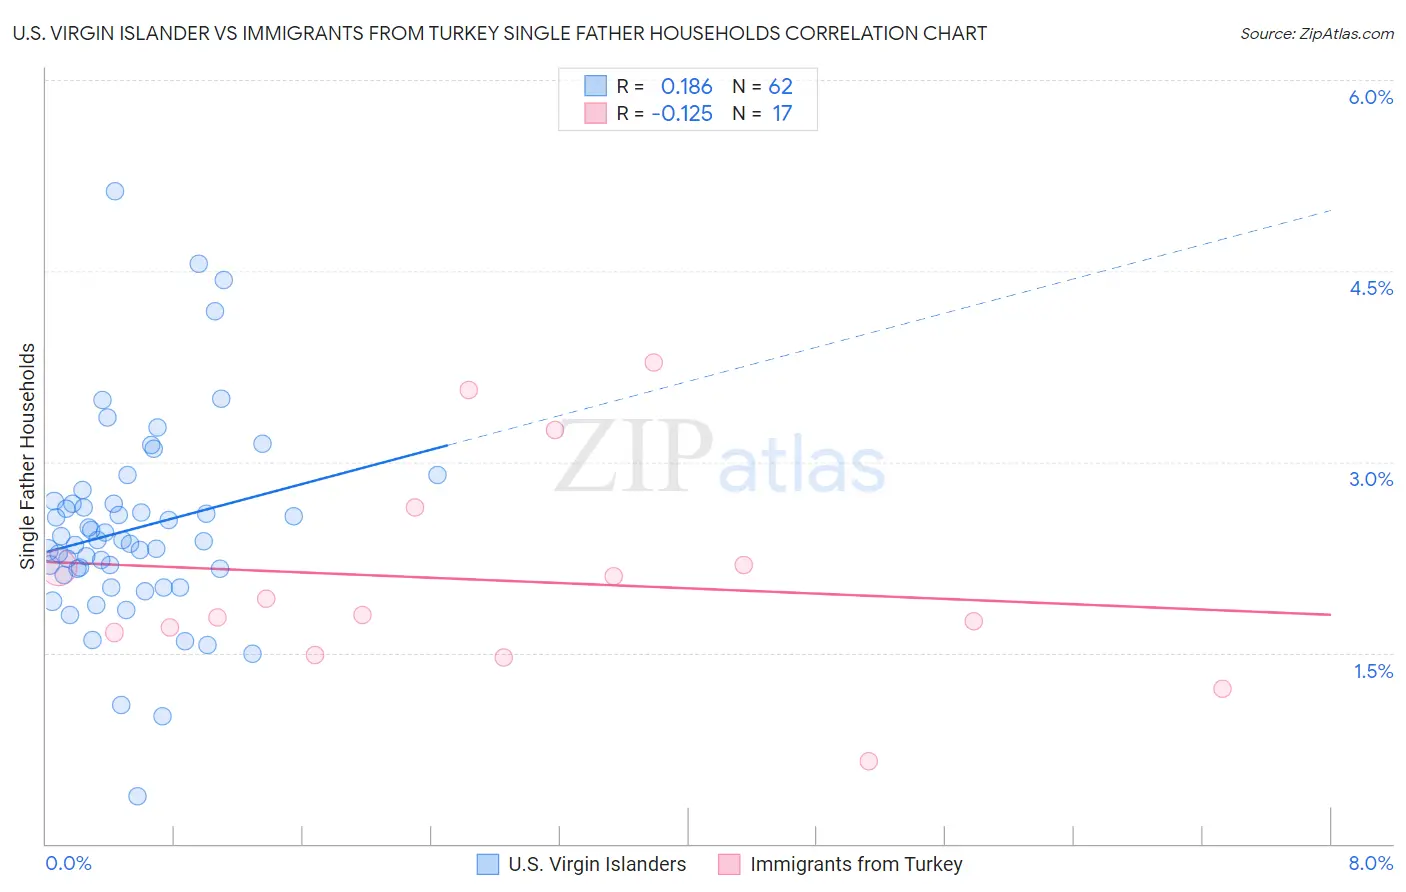
U.S. Virgin Islander vs Immigrants from Turkey Single Father Households Correlation Chart
The statistical analysis conducted on geographies consisting of 87,373,145 people shows a poor positive correlation between the proportion of U.S. Virgin Islanders and percentage of single father households in the United States with a correlation coefficient (R) of 0.186 and weighted average of 2.4%. Similarly, the statistical analysis conducted on geographies consisting of 221,918,090 people shows a poor negative correlation between the proportion of Immigrants from Turkey and percentage of single father households in the United States with a correlation coefficient (R) of -0.125 and weighted average of 2.0%, a difference of 18.8%.
Single Father Households Correlation Summary
| Measurement | U.S. Virgin Islander | Immigrants from Turkey |
| Minimum | 0.38% | 0.65% |
| Maximum | 5.1% | 3.8% |
| Range | 4.7% | 3.1% |
| Mean | 2.5% | 2.1% |
| Median | 2.4% | 1.8% |
| Interquartile 25% (IQ1) | 2.1% | 1.6% |
| Interquartile 75% (IQ3) | 2.7% | 2.4% |
| Interquartile Range (IQR) | 0.57% | 0.84% |
| Standard Deviation (Sample) | 0.80% | 0.83% |
| Standard Deviation (Population) | 0.79% | 0.80% |
Similar Demographics by Single Father Households
Demographics Similar to U.S. Virgin Islanders by Single Father Households
In terms of single father households, the demographic groups most similar to U.S. Virgin Islanders are French (2.4%, a difference of 0.0%), Hmong (2.4%, a difference of 0.10%), Immigrants from Africa (2.4%, a difference of 0.15%), Immigrants from Sudan (2.4%, a difference of 0.17%), and Immigrants from Colombia (2.4%, a difference of 0.18%).
| Demographics | Rating | Rank | Single Father Households |
| Belgians | 43.3 /100 | #182 | Average 2.3% |
| Immigrants | Panama | 41.8 /100 | #183 | Average 2.4% |
| Sri Lankans | 41.8 /100 | #184 | Average 2.4% |
| Nigerians | 41.0 /100 | #185 | Average 2.4% |
| Immigrants | Bosnia and Herzegovina | 40.4 /100 | #186 | Average 2.4% |
| Immigrants | Colombia | 34.0 /100 | #187 | Fair 2.4% |
| Hmong | 33.0 /100 | #188 | Fair 2.4% |
| U.S. Virgin Islanders | 31.8 /100 | #189 | Fair 2.4% |
| French | 31.7 /100 | #190 | Fair 2.4% |
| Immigrants | Africa | 30.0 /100 | #191 | Fair 2.4% |
| Immigrants | Sudan | 29.8 /100 | #192 | Fair 2.4% |
| Uruguayans | 29.7 /100 | #193 | Fair 2.4% |
| Panamanians | 29.6 /100 | #194 | Fair 2.4% |
| Immigrants | Philippines | 28.7 /100 | #195 | Fair 2.4% |
| Kenyans | 28.0 /100 | #196 | Fair 2.4% |
Demographics Similar to Immigrants from Turkey by Single Father Households
In terms of single father households, the demographic groups most similar to Immigrants from Turkey are Macedonian (2.0%, a difference of 0.15%), Immigrants from Bulgaria (2.0%, a difference of 0.18%), Immigrants from Eastern Europe (2.0%, a difference of 0.23%), Immigrants from Sri Lanka (2.0%, a difference of 0.23%), and Immigrants from Grenada (2.0%, a difference of 0.38%).
| Demographics | Rating | Rank | Single Father Households |
| Immigrants | Australia | 100.0 /100 | #34 | Exceptional 2.0% |
| Albanians | 100.0 /100 | #35 | Exceptional 2.0% |
| Immigrants | Belgium | 100.0 /100 | #36 | Exceptional 2.0% |
| Immigrants | St. Vincent and the Grenadines | 100.0 /100 | #37 | Exceptional 2.0% |
| Immigrants | Eastern Europe | 100.0 /100 | #38 | Exceptional 2.0% |
| Immigrants | Sri Lanka | 100.0 /100 | #39 | Exceptional 2.0% |
| Immigrants | Bulgaria | 100.0 /100 | #40 | Exceptional 2.0% |
| Immigrants | Turkey | 100.0 /100 | #41 | Exceptional 2.0% |
| Macedonians | 100.0 /100 | #42 | Exceptional 2.0% |
| Immigrants | Grenada | 100.0 /100 | #43 | Exceptional 2.0% |
| Latvians | 100.0 /100 | #44 | Exceptional 2.0% |
| Russians | 100.0 /100 | #45 | Exceptional 2.0% |
| Immigrants | Lebanon | 100.0 /100 | #46 | Exceptional 2.0% |
| Immigrants | Ukraine | 99.9 /100 | #47 | Exceptional 2.0% |
| Immigrants | Kazakhstan | 99.9 /100 | #48 | Exceptional 2.0% |