U.S. Virgin Islander vs Cambodian Bachelor's Degree
COMPARE
U.S. Virgin Islander
Cambodian
Bachelor's Degree
Bachelor's Degree Comparison
U.S. Virgin Islanders
Cambodians
33.2%
BACHELOR'S DEGREE
0.7/ 100
METRIC RATING
253rd/ 347
METRIC RANK
47.2%
BACHELOR'S DEGREE
100.0/ 100
METRIC RATING
19th/ 347
METRIC RANK
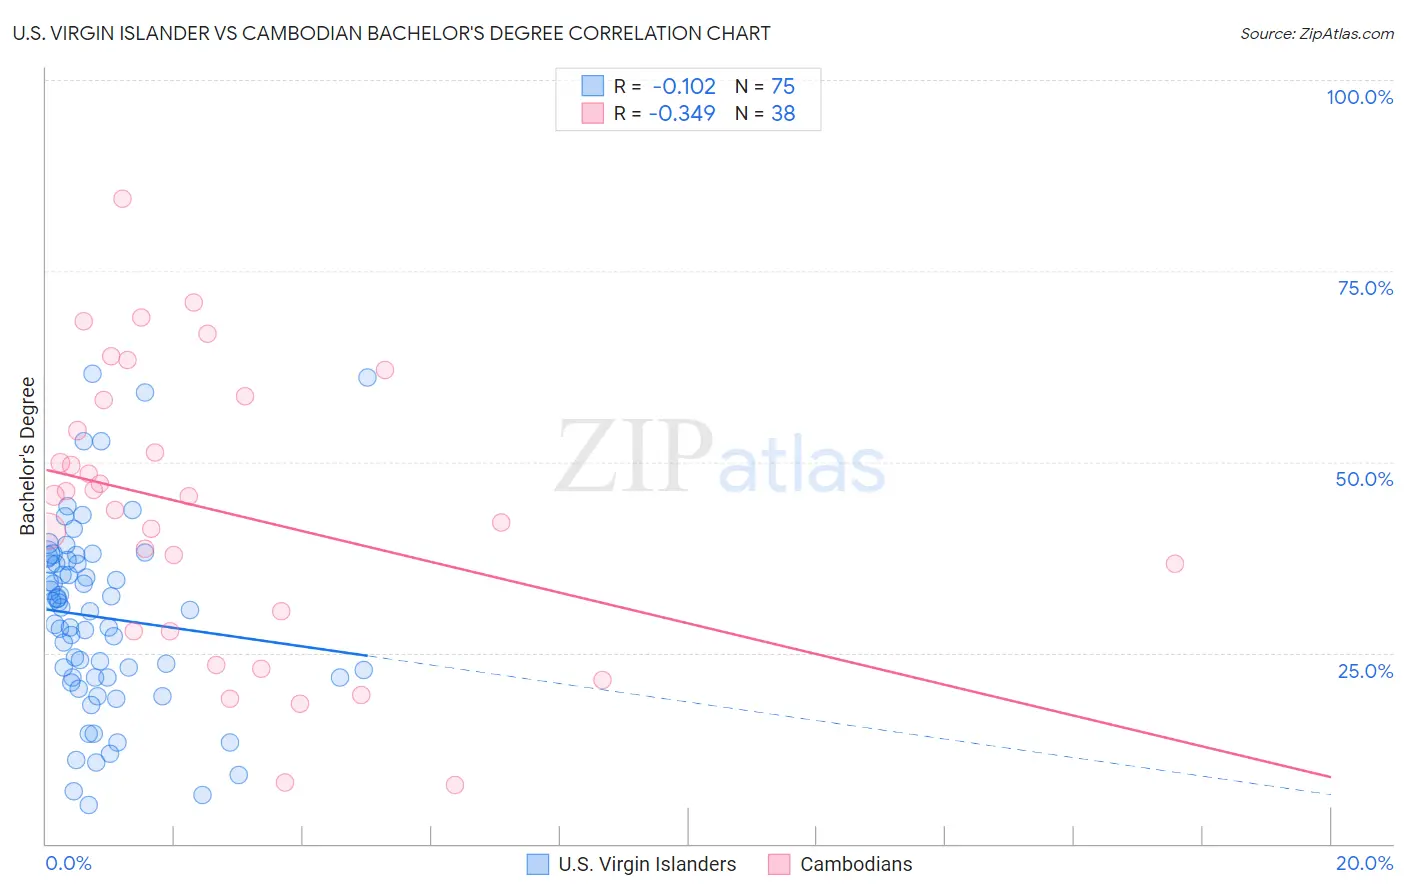
U.S. Virgin Islander vs Cambodian Bachelor's Degree Correlation Chart
The statistical analysis conducted on geographies consisting of 87,527,119 people shows a poor negative correlation between the proportion of U.S. Virgin Islanders and percentage of population with at least bachelor's degree education in the United States with a correlation coefficient (R) of -0.102 and weighted average of 33.2%. Similarly, the statistical analysis conducted on geographies consisting of 102,512,775 people shows a mild negative correlation between the proportion of Cambodians and percentage of population with at least bachelor's degree education in the United States with a correlation coefficient (R) of -0.349 and weighted average of 47.2%, a difference of 42.1%.
Bachelor's Degree Correlation Summary
| Measurement | U.S. Virgin Islander | Cambodian |
| Minimum | 5.1% | 7.6% |
| Maximum | 61.5% | 84.4% |
| Range | 56.4% | 76.8% |
| Mean | 29.6% | 43.6% |
| Median | 30.7% | 45.6% |
| Interquartile 25% (IQ1) | 21.7% | 27.8% |
| Interquartile 75% (IQ3) | 37.1% | 58.1% |
| Interquartile Range (IQR) | 15.4% | 30.3% |
| Standard Deviation (Sample) | 12.3% | 18.4% |
| Standard Deviation (Population) | 12.2% | 18.2% |
Similar Demographics by Bachelor's Degree
Demographics Similar to U.S. Virgin Islanders by Bachelor's Degree
In terms of bachelor's degree, the demographic groups most similar to U.S. Virgin Islanders are Native Hawaiian (33.2%, a difference of 0.060%), Iroquois (33.2%, a difference of 0.080%), Immigrants from Bahamas (33.3%, a difference of 0.21%), Nicaraguan (33.1%, a difference of 0.27%), and Japanese (33.3%, a difference of 0.28%).
| Demographics | Rating | Rank | Bachelor's Degree |
| Jamaicans | 1.0 /100 | #246 | Tragic 33.6% |
| Immigrants | Congo | 1.0 /100 | #247 | Tragic 33.6% |
| Cree | 1.0 /100 | #248 | Tragic 33.6% |
| Immigrants | Liberia | 0.9 /100 | #249 | Tragic 33.5% |
| Indonesians | 0.9 /100 | #250 | Tragic 33.5% |
| Japanese | 0.7 /100 | #251 | Tragic 33.3% |
| Immigrants | Bahamas | 0.7 /100 | #252 | Tragic 33.3% |
| U.S. Virgin Islanders | 0.7 /100 | #253 | Tragic 33.2% |
| Native Hawaiians | 0.7 /100 | #254 | Tragic 33.2% |
| Iroquois | 0.7 /100 | #255 | Tragic 33.2% |
| Nicaraguans | 0.6 /100 | #256 | Tragic 33.1% |
| Spanish Americans | 0.6 /100 | #257 | Tragic 33.1% |
| French American Indians | 0.6 /100 | #258 | Tragic 33.1% |
| Osage | 0.5 /100 | #259 | Tragic 33.0% |
| Malaysians | 0.5 /100 | #260 | Tragic 32.9% |
Demographics Similar to Cambodians by Bachelor's Degree
In terms of bachelor's degree, the demographic groups most similar to Cambodians are Immigrants from Switzerland (47.1%, a difference of 0.22%), Immigrants from Ireland (47.1%, a difference of 0.23%), Indian (Asian) (47.4%, a difference of 0.43%), Immigrants from Belgium (47.0%, a difference of 0.43%), and Immigrants from Sweden (47.0%, a difference of 0.52%).
| Demographics | Rating | Rank | Bachelor's Degree |
| Immigrants | China | 100.0 /100 | #12 | Exceptional 48.4% |
| Immigrants | South Central Asia | 100.0 /100 | #13 | Exceptional 48.3% |
| Immigrants | Hong Kong | 100.0 /100 | #14 | Exceptional 48.2% |
| Immigrants | Eastern Asia | 100.0 /100 | #15 | Exceptional 48.1% |
| Soviet Union | 100.0 /100 | #16 | Exceptional 47.9% |
| Eastern Europeans | 100.0 /100 | #17 | Exceptional 47.5% |
| Indians (Asian) | 100.0 /100 | #18 | Exceptional 47.4% |
| Cambodians | 100.0 /100 | #19 | Exceptional 47.2% |
| Immigrants | Switzerland | 100.0 /100 | #20 | Exceptional 47.1% |
| Immigrants | Ireland | 100.0 /100 | #21 | Exceptional 47.1% |
| Immigrants | Belgium | 100.0 /100 | #22 | Exceptional 47.0% |
| Immigrants | Sweden | 100.0 /100 | #23 | Exceptional 47.0% |
| Immigrants | Korea | 100.0 /100 | #24 | Exceptional 47.0% |
| Burmese | 100.0 /100 | #25 | Exceptional 46.9% |
| Immigrants | Japan | 100.0 /100 | #26 | Exceptional 46.8% |