U.S. Virgin Islander vs Bulgarian GED/Equivalency
COMPARE
U.S. Virgin Islander
Bulgarian
GED/Equivalency
GED/Equivalency Comparison
U.S. Virgin Islanders
Bulgarians
82.9%
GED/EQUIVALENCY
0.2/ 100
METRIC RATING
271st/ 347
METRIC RANK
89.0%
GED/EQUIVALENCY
99.9/ 100
METRIC RATING
11th/ 347
METRIC RANK
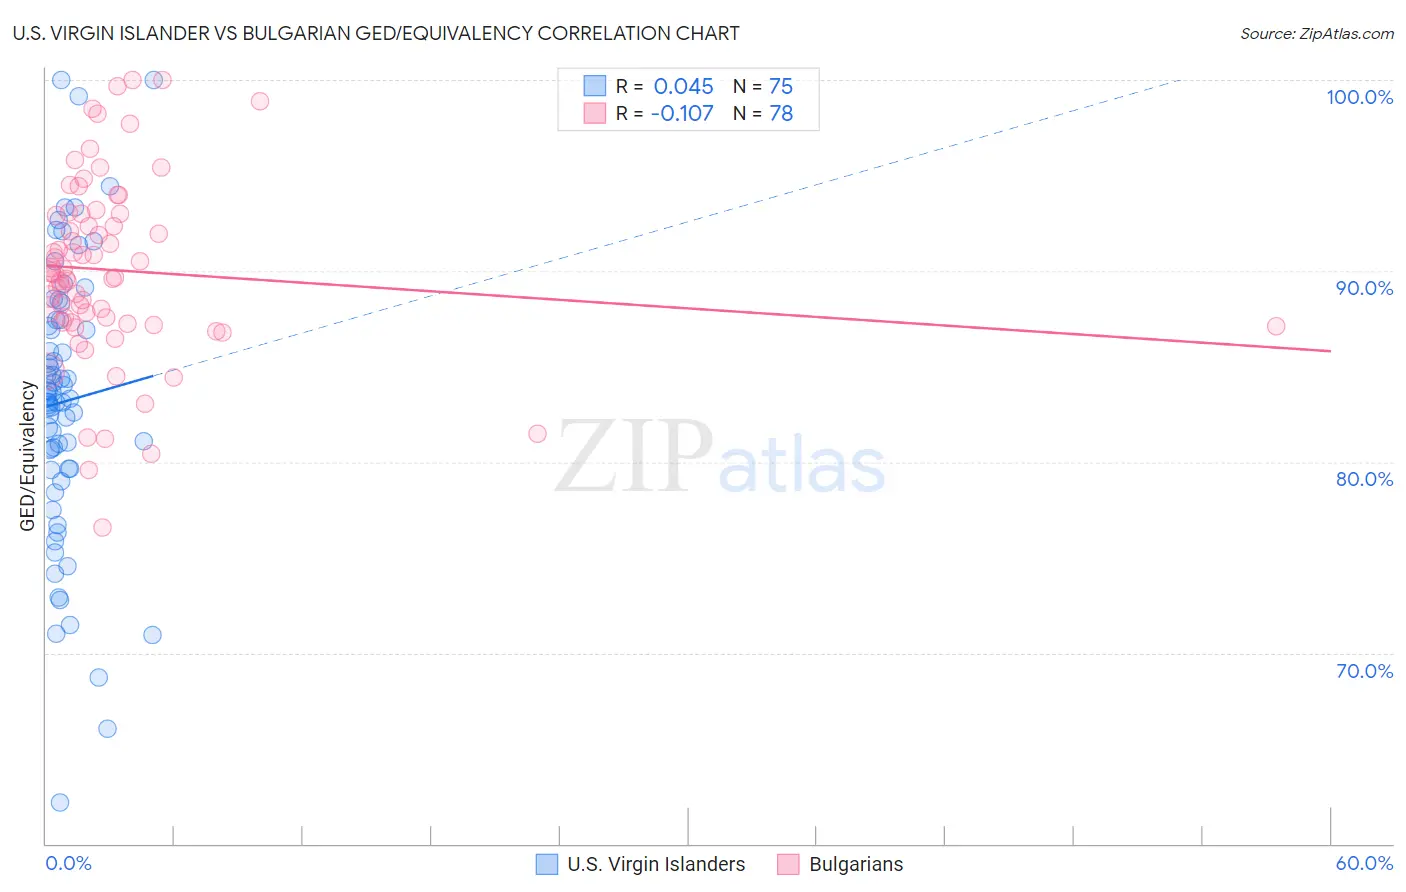
U.S. Virgin Islander vs Bulgarian GED/Equivalency Correlation Chart
The statistical analysis conducted on geographies consisting of 87,529,761 people shows no correlation between the proportion of U.S. Virgin Islanders and percentage of population with at least ged/equivalency education in the United States with a correlation coefficient (R) of 0.045 and weighted average of 82.9%. Similarly, the statistical analysis conducted on geographies consisting of 205,633,746 people shows a poor negative correlation between the proportion of Bulgarians and percentage of population with at least ged/equivalency education in the United States with a correlation coefficient (R) of -0.107 and weighted average of 89.0%, a difference of 7.3%.
GED/Equivalency Correlation Summary
| Measurement | U.S. Virgin Islander | Bulgarian |
| Minimum | 62.2% | 76.5% |
| Maximum | 100.0% | 100.0% |
| Range | 37.8% | 23.5% |
| Mean | 83.2% | 90.0% |
| Median | 83.3% | 89.9% |
| Interquartile 25% (IQ1) | 79.6% | 87.3% |
| Interquartile 75% (IQ3) | 87.4% | 93.0% |
| Interquartile Range (IQR) | 7.8% | 5.6% |
| Standard Deviation (Sample) | 7.3% | 4.8% |
| Standard Deviation (Population) | 7.3% | 4.8% |
Similar Demographics by GED/Equivalency
Demographics Similar to U.S. Virgin Islanders by GED/Equivalency
In terms of ged/equivalency, the demographic groups most similar to U.S. Virgin Islanders are Immigrants from Jamaica (82.9%, a difference of 0.040%), Barbadian (82.9%, a difference of 0.040%), Pennsylvania German (82.9%, a difference of 0.050%), Immigrants from Trinidad and Tobago (82.8%, a difference of 0.070%), and Hopi (83.0%, a difference of 0.090%).
| Demographics | Rating | Rank | GED/Equivalency |
| Bangladeshis | 0.2 /100 | #264 | Tragic 83.1% |
| West Indians | 0.2 /100 | #265 | Tragic 83.1% |
| Kiowa | 0.2 /100 | #266 | Tragic 83.1% |
| Trinidadians and Tobagonians | 0.2 /100 | #267 | Tragic 83.0% |
| Immigrants | Burma/Myanmar | 0.2 /100 | #268 | Tragic 83.0% |
| Hopi | 0.2 /100 | #269 | Tragic 83.0% |
| Immigrants | Jamaica | 0.2 /100 | #270 | Tragic 82.9% |
| U.S. Virgin Islanders | 0.2 /100 | #271 | Tragic 82.9% |
| Barbadians | 0.1 /100 | #272 | Tragic 82.9% |
| Pennsylvania Germans | 0.1 /100 | #273 | Tragic 82.9% |
| Immigrants | Trinidad and Tobago | 0.1 /100 | #274 | Tragic 82.8% |
| Seminole | 0.1 /100 | #275 | Tragic 82.8% |
| Blacks/African Americans | 0.1 /100 | #276 | Tragic 82.8% |
| Arapaho | 0.1 /100 | #277 | Tragic 82.8% |
| Immigrants | Laos | 0.1 /100 | #278 | Tragic 82.7% |
Demographics Similar to Bulgarians by GED/Equivalency
In terms of ged/equivalency, the demographic groups most similar to Bulgarians are Norwegian (89.0%, a difference of 0.040%), Lithuanian (88.9%, a difference of 0.040%), Immigrants from Iran (88.9%, a difference of 0.050%), Chinese (89.0%, a difference of 0.080%), and Cypriot (88.9%, a difference of 0.080%).
| Demographics | Rating | Rank | GED/Equivalency |
| Iranians | 100.0 /100 | #4 | Exceptional 89.2% |
| Latvians | 100.0 /100 | #5 | Exceptional 89.2% |
| Thais | 100.0 /100 | #6 | Exceptional 89.1% |
| Eastern Europeans | 99.9 /100 | #7 | Exceptional 89.1% |
| Carpatho Rusyns | 99.9 /100 | #8 | Exceptional 89.1% |
| Chinese | 99.9 /100 | #9 | Exceptional 89.0% |
| Norwegians | 99.9 /100 | #10 | Exceptional 89.0% |
| Bulgarians | 99.9 /100 | #11 | Exceptional 89.0% |
| Lithuanians | 99.9 /100 | #12 | Exceptional 88.9% |
| Immigrants | Iran | 99.9 /100 | #13 | Exceptional 88.9% |
| Cypriots | 99.9 /100 | #14 | Exceptional 88.9% |
| Okinawans | 99.9 /100 | #15 | Exceptional 88.9% |
| Immigrants | Taiwan | 99.9 /100 | #16 | Exceptional 88.8% |
| Croatians | 99.9 /100 | #17 | Exceptional 88.8% |
| Slovenes | 99.9 /100 | #18 | Exceptional 88.8% |