U.S. Virgin Islander vs Cuban GED/Equivalency
COMPARE
U.S. Virgin Islander
Cuban
GED/Equivalency
GED/Equivalency Comparison
U.S. Virgin Islanders
Cubans
82.9%
GED/EQUIVALENCY
0.2/ 100
METRIC RATING
271st/ 347
METRIC RANK
82.0%
GED/EQUIVALENCY
0.0/ 100
METRIC RATING
291st/ 347
METRIC RANK
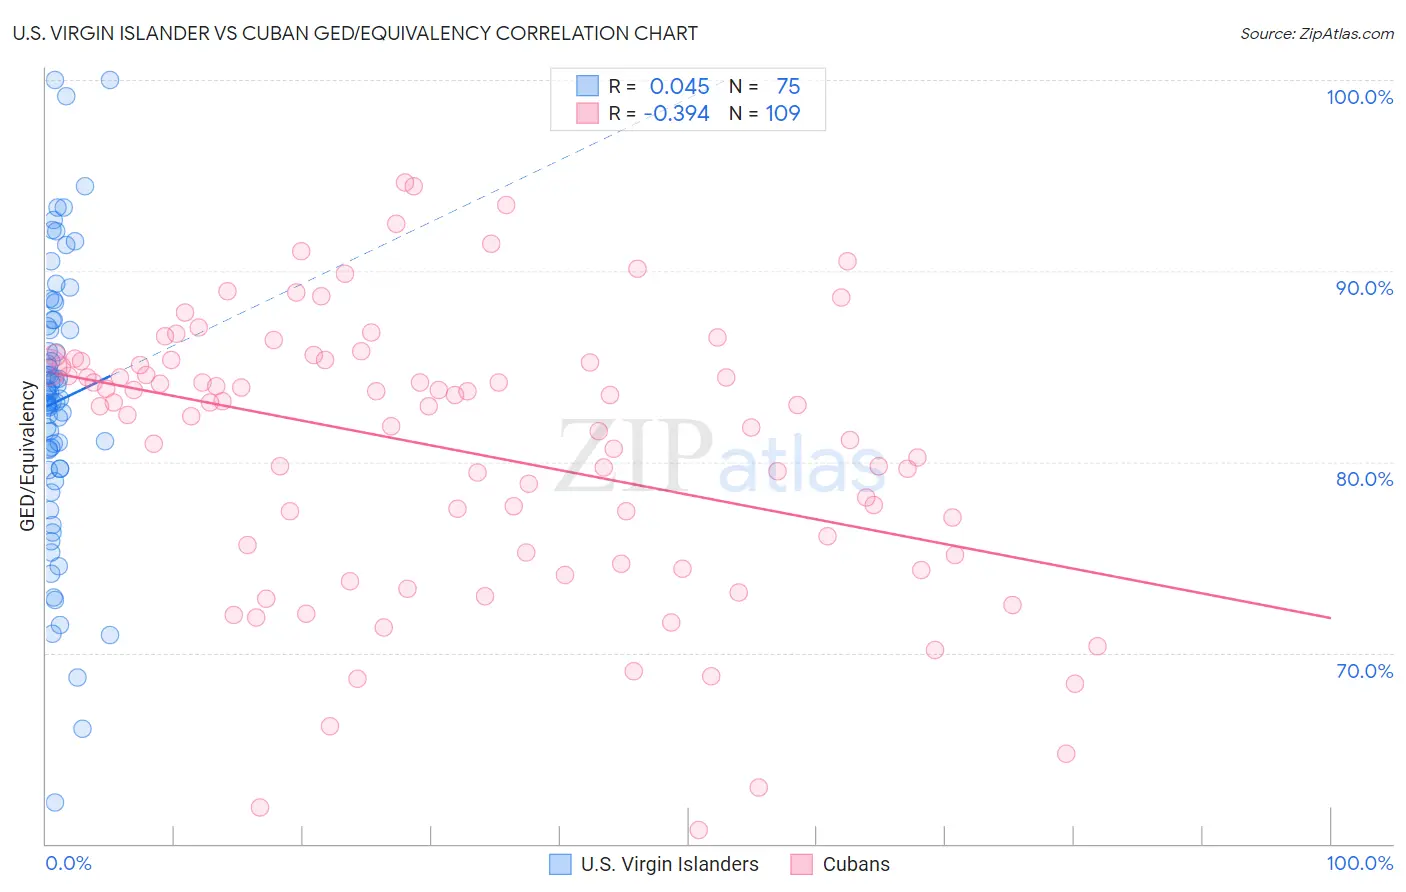
U.S. Virgin Islander vs Cuban GED/Equivalency Correlation Chart
The statistical analysis conducted on geographies consisting of 87,529,761 people shows no correlation between the proportion of U.S. Virgin Islanders and percentage of population with at least ged/equivalency education in the United States with a correlation coefficient (R) of 0.045 and weighted average of 82.9%. Similarly, the statistical analysis conducted on geographies consisting of 449,373,028 people shows a mild negative correlation between the proportion of Cubans and percentage of population with at least ged/equivalency education in the United States with a correlation coefficient (R) of -0.394 and weighted average of 82.0%, a difference of 1.0%.
GED/Equivalency Correlation Summary
| Measurement | U.S. Virgin Islander | Cuban |
| Minimum | 62.2% | 60.7% |
| Maximum | 100.0% | 94.6% |
| Range | 37.8% | 33.9% |
| Mean | 83.2% | 80.6% |
| Median | 83.3% | 82.9% |
| Interquartile 25% (IQ1) | 79.6% | 75.2% |
| Interquartile 75% (IQ3) | 87.4% | 85.2% |
| Interquartile Range (IQR) | 7.8% | 10.1% |
| Standard Deviation (Sample) | 7.3% | 7.2% |
| Standard Deviation (Population) | 7.3% | 7.2% |
Demographics Similar to U.S. Virgin Islanders and Cubans by GED/Equivalency
In terms of ged/equivalency, the demographic groups most similar to U.S. Virgin Islanders are Barbadian (82.9%, a difference of 0.040%), Pennsylvania German (82.9%, a difference of 0.050%), Immigrants from Trinidad and Tobago (82.8%, a difference of 0.070%), Seminole (82.8%, a difference of 0.13%), and Black/African American (82.8%, a difference of 0.15%). Similarly, the demographic groups most similar to Cubans are Haitian (82.1%, a difference of 0.020%), Immigrants from Cambodia (82.2%, a difference of 0.22%), Pueblo (82.3%, a difference of 0.30%), Japanese (82.4%, a difference of 0.40%), and Immigrants from West Indies (82.4%, a difference of 0.41%).
| Demographics | Rating | Rank | GED/Equivalency |
| U.S. Virgin Islanders | 0.2 /100 | #271 | Tragic 82.9% |
| Barbadians | 0.1 /100 | #272 | Tragic 82.9% |
| Pennsylvania Germans | 0.1 /100 | #273 | Tragic 82.9% |
| Immigrants | Trinidad and Tobago | 0.1 /100 | #274 | Tragic 82.8% |
| Seminole | 0.1 /100 | #275 | Tragic 82.8% |
| Blacks/African Americans | 0.1 /100 | #276 | Tragic 82.8% |
| Arapaho | 0.1 /100 | #277 | Tragic 82.8% |
| Immigrants | Laos | 0.1 /100 | #278 | Tragic 82.7% |
| Immigrants | Fiji | 0.1 /100 | #279 | Tragic 82.7% |
| Cheyenne | 0.1 /100 | #280 | Tragic 82.7% |
| Sioux | 0.1 /100 | #281 | Tragic 82.6% |
| Immigrants | Immigrants | 0.1 /100 | #282 | Tragic 82.6% |
| Indonesians | 0.1 /100 | #283 | Tragic 82.5% |
| Immigrants | Barbados | 0.1 /100 | #284 | Tragic 82.4% |
| Cajuns | 0.0 /100 | #285 | Tragic 82.4% |
| Immigrants | West Indies | 0.0 /100 | #286 | Tragic 82.4% |
| Japanese | 0.0 /100 | #287 | Tragic 82.4% |
| Pueblo | 0.0 /100 | #288 | Tragic 82.3% |
| Immigrants | Cambodia | 0.0 /100 | #289 | Tragic 82.2% |
| Haitians | 0.0 /100 | #290 | Tragic 82.1% |
| Cubans | 0.0 /100 | #291 | Tragic 82.0% |