U.S. Virgin Islander vs Immigrants from Afghanistan 12th Grade, No Diploma
COMPARE
U.S. Virgin Islander
Immigrants from Afghanistan
12th Grade, No Diploma
12th Grade, No Diploma Comparison
U.S. Virgin Islanders
Immigrants from Afghanistan
89.3%
12TH GRADE, NO DIPLOMA
0.1/ 100
METRIC RATING
269th/ 347
METRIC RANK
90.6%
12TH GRADE, NO DIPLOMA
11.0/ 100
METRIC RATING
209th/ 347
METRIC RANK
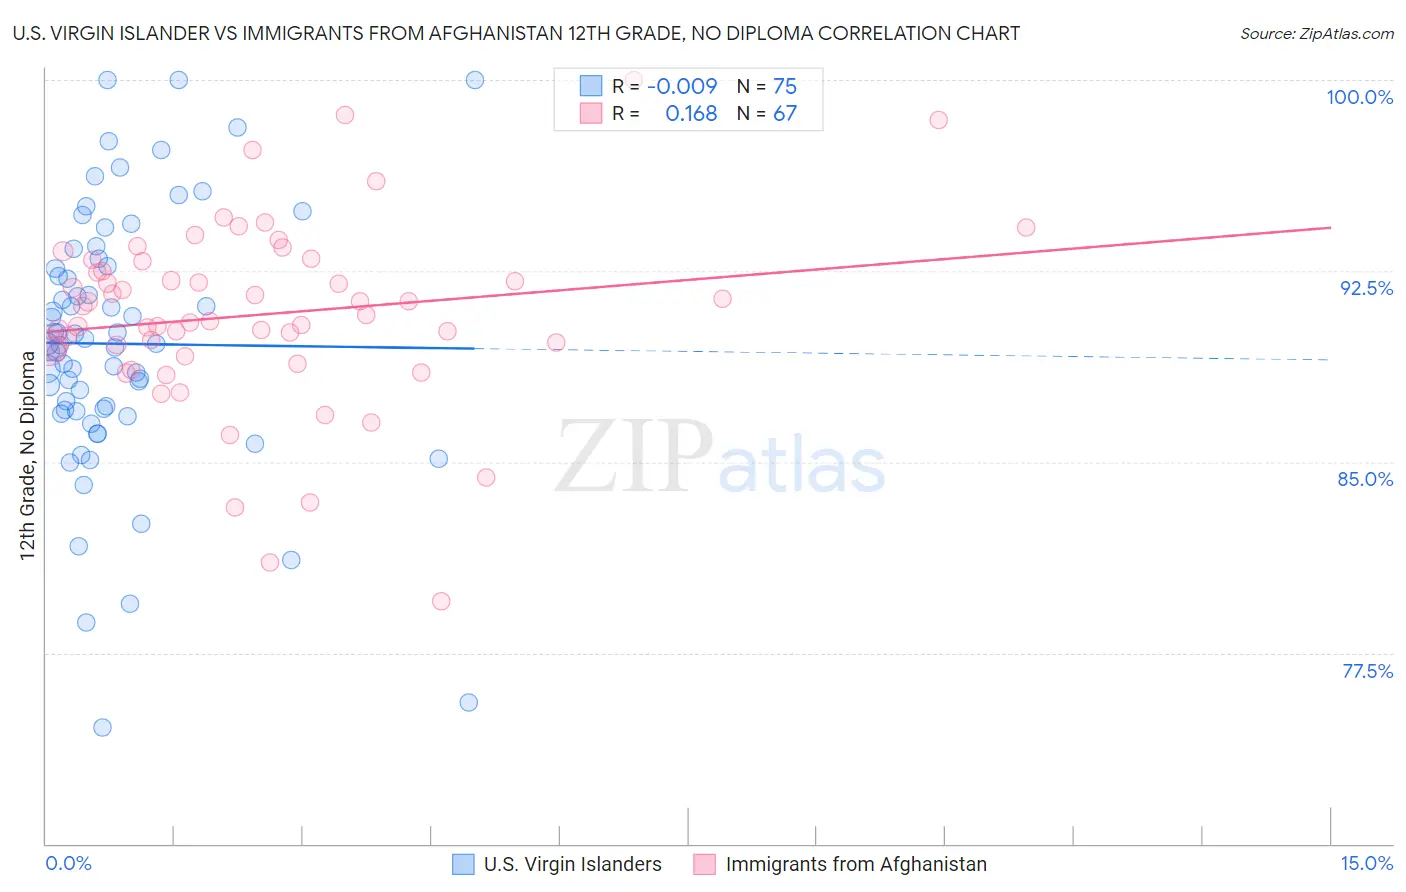
U.S. Virgin Islander vs Immigrants from Afghanistan 12th Grade, No Diploma Correlation Chart
The statistical analysis conducted on geographies consisting of 87,529,761 people shows no correlation between the proportion of U.S. Virgin Islanders and percentage of population with at least 12th grade (no diploma) education in the United States with a correlation coefficient (R) of -0.009 and weighted average of 89.3%. Similarly, the statistical analysis conducted on geographies consisting of 147,629,579 people shows a poor positive correlation between the proportion of Immigrants from Afghanistan and percentage of population with at least 12th grade (no diploma) education in the United States with a correlation coefficient (R) of 0.168 and weighted average of 90.6%, a difference of 1.4%.
12th Grade, No Diploma Correlation Summary
| Measurement | U.S. Virgin Islander | Immigrants from Afghanistan |
| Minimum | 74.6% | 79.5% |
| Maximum | 100.0% | 100.0% |
| Range | 25.4% | 20.5% |
| Mean | 89.6% | 90.8% |
| Median | 89.6% | 90.8% |
| Interquartile 25% (IQ1) | 87.0% | 89.5% |
| Interquartile 75% (IQ3) | 92.7% | 92.9% |
| Interquartile Range (IQR) | 5.7% | 3.4% |
| Standard Deviation (Sample) | 5.1% | 3.7% |
| Standard Deviation (Population) | 5.1% | 3.6% |
Similar Demographics by 12th Grade, No Diploma
Demographics Similar to U.S. Virgin Islanders by 12th Grade, No Diploma
In terms of 12th grade, no diploma, the demographic groups most similar to U.S. Virgin Islanders are Immigrants from Trinidad and Tobago (89.3%, a difference of 0.040%), Bangladeshi (89.3%, a difference of 0.050%), Black/African American (89.3%, a difference of 0.050%), Seminole (89.4%, a difference of 0.060%), and West Indian (89.3%, a difference of 0.060%).
| Demographics | Rating | Rank | 12th Grade, No Diploma |
| Sioux | 0.4 /100 | #262 | Tragic 89.6% |
| Immigrants | Jamaica | 0.2 /100 | #263 | Tragic 89.5% |
| Sri Lankans | 0.2 /100 | #264 | Tragic 89.4% |
| Trinidadians and Tobagonians | 0.2 /100 | #265 | Tragic 89.4% |
| Seminole | 0.2 /100 | #266 | Tragic 89.4% |
| West Indians | 0.2 /100 | #267 | Tragic 89.3% |
| Immigrants | Trinidad and Tobago | 0.1 /100 | #268 | Tragic 89.3% |
| U.S. Virgin Islanders | 0.1 /100 | #269 | Tragic 89.3% |
| Bangladeshis | 0.1 /100 | #270 | Tragic 89.3% |
| Blacks/African Americans | 0.1 /100 | #271 | Tragic 89.3% |
| Malaysians | 0.1 /100 | #272 | Tragic 89.2% |
| Barbadians | 0.1 /100 | #273 | Tragic 89.1% |
| Cajuns | 0.1 /100 | #274 | Tragic 89.1% |
| Immigrants | Congo | 0.1 /100 | #275 | Tragic 89.0% |
| Ute | 0.1 /100 | #276 | Tragic 89.0% |
Demographics Similar to Immigrants from Afghanistan by 12th Grade, No Diploma
In terms of 12th grade, no diploma, the demographic groups most similar to Immigrants from Afghanistan are Immigrants from Micronesia (90.6%, a difference of 0.0%), South American Indian (90.6%, a difference of 0.0%), Portuguese (90.6%, a difference of 0.010%), Armenian (90.6%, a difference of 0.020%), and Somali (90.6%, a difference of 0.020%).
| Demographics | Rating | Rank | 12th Grade, No Diploma |
| Marshallese | 18.2 /100 | #202 | Poor 90.7% |
| Tongans | 16.1 /100 | #203 | Poor 90.7% |
| French American Indians | 15.5 /100 | #204 | Poor 90.7% |
| Immigrants | Sierra Leone | 14.9 /100 | #205 | Poor 90.7% |
| Immigrants | Bolivia | 12.3 /100 | #206 | Poor 90.6% |
| Armenians | 11.6 /100 | #207 | Poor 90.6% |
| Immigrants | Micronesia | 11.0 /100 | #208 | Poor 90.6% |
| Immigrants | Afghanistan | 11.0 /100 | #209 | Poor 90.6% |
| South American Indians | 10.9 /100 | #210 | Poor 90.6% |
| Portuguese | 10.6 /100 | #211 | Poor 90.6% |
| Somalis | 10.2 /100 | #212 | Poor 90.6% |
| Costa Ricans | 9.4 /100 | #213 | Tragic 90.5% |
| Immigrants | Africa | 8.5 /100 | #214 | Tragic 90.5% |
| Arapaho | 7.7 /100 | #215 | Tragic 90.5% |
| Shoshone | 7.5 /100 | #216 | Tragic 90.5% |