Uruguayan vs Brazilian 8th Grade
COMPARE
Uruguayan
Brazilian
8th Grade
8th Grade Comparison
Uruguayans
Brazilians
95.1%
8TH GRADE
1.2/ 100
METRIC RATING
248th/ 347
METRIC RANK
95.6%
8TH GRADE
34.8/ 100
METRIC RATING
186th/ 347
METRIC RANK
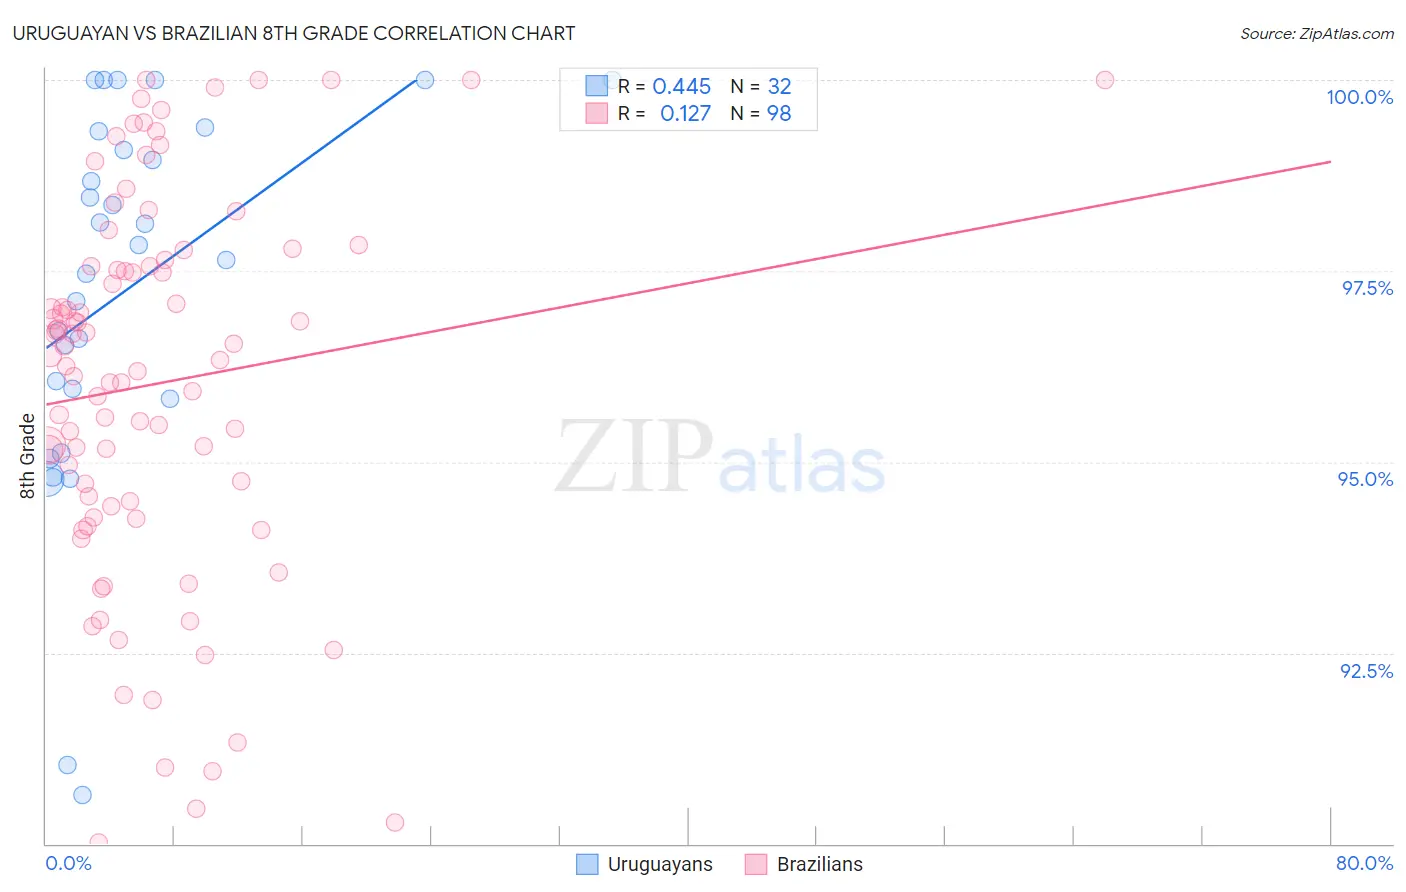
Uruguayan vs Brazilian 8th Grade Correlation Chart
The statistical analysis conducted on geographies consisting of 144,782,794 people shows a moderate positive correlation between the proportion of Uruguayans and percentage of population with at least 8th grade education in the United States with a correlation coefficient (R) of 0.445 and weighted average of 95.1%. Similarly, the statistical analysis conducted on geographies consisting of 323,961,610 people shows a poor positive correlation between the proportion of Brazilians and percentage of population with at least 8th grade education in the United States with a correlation coefficient (R) of 0.127 and weighted average of 95.6%, a difference of 0.61%.
8th Grade Correlation Summary
| Measurement | Uruguayan | Brazilian |
| Minimum | 90.6% | 90.0% |
| Maximum | 100.0% | 100.0% |
| Range | 9.4% | 10.0% |
| Mean | 97.3% | 96.0% |
| Median | 97.7% | 96.4% |
| Interquartile 25% (IQ1) | 95.9% | 94.4% |
| Interquartile 75% (IQ3) | 99.2% | 97.6% |
| Interquartile Range (IQR) | 3.3% | 3.1% |
| Standard Deviation (Sample) | 2.4% | 2.5% |
| Standard Deviation (Population) | 2.4% | 2.5% |
Similar Demographics by 8th Grade
Demographics Similar to Uruguayans by 8th Grade
In terms of 8th grade, the demographic groups most similar to Uruguayans are Immigrants from Senegal (95.1%, a difference of 0.010%), Jamaican (95.1%, a difference of 0.020%), Somali (95.1%, a difference of 0.020%), Immigrants from China (95.0%, a difference of 0.020%), and Korean (95.0%, a difference of 0.020%).
| Demographics | Rating | Rank | 8th Grade |
| South American Indians | 1.9 /100 | #241 | Tragic 95.1% |
| Tongans | 1.7 /100 | #242 | Tragic 95.1% |
| Paiute | 1.7 /100 | #243 | Tragic 95.1% |
| Immigrants | Middle Africa | 1.7 /100 | #244 | Tragic 95.1% |
| Jamaicans | 1.4 /100 | #245 | Tragic 95.1% |
| Somalis | 1.4 /100 | #246 | Tragic 95.1% |
| Immigrants | Senegal | 1.4 /100 | #247 | Tragic 95.1% |
| Uruguayans | 1.2 /100 | #248 | Tragic 95.1% |
| Immigrants | China | 1.1 /100 | #249 | Tragic 95.0% |
| Koreans | 1.1 /100 | #250 | Tragic 95.0% |
| Bolivians | 1.0 /100 | #251 | Tragic 95.0% |
| Immigrants | Ethiopia | 1.0 /100 | #252 | Tragic 95.0% |
| U.S. Virgin Islanders | 0.9 /100 | #253 | Tragic 95.0% |
| Immigrants | Cameroon | 0.8 /100 | #254 | Tragic 95.0% |
| Immigrants | Somalia | 0.7 /100 | #255 | Tragic 95.0% |
Demographics Similar to Brazilians by 8th Grade
In terms of 8th grade, the demographic groups most similar to Brazilians are Black/African American (95.6%, a difference of 0.0%), Immigrants from Iraq (95.6%, a difference of 0.010%), Immigrants from Uganda (95.6%, a difference of 0.010%), Sudanese (95.6%, a difference of 0.010%), and Immigrants from Egypt (95.7%, a difference of 0.020%).
| Demographics | Rating | Rank | 8th Grade |
| Immigrants | Brazil | 45.4 /100 | #179 | Average 95.7% |
| Iraqis | 40.5 /100 | #180 | Average 95.7% |
| Immigrants | Spain | 38.7 /100 | #181 | Fair 95.7% |
| Immigrants | Egypt | 37.9 /100 | #182 | Fair 95.7% |
| Immigrants | Iraq | 36.2 /100 | #183 | Fair 95.6% |
| Immigrants | Uganda | 36.0 /100 | #184 | Fair 95.6% |
| Blacks/African Americans | 34.8 /100 | #185 | Fair 95.6% |
| Brazilians | 34.8 /100 | #186 | Fair 95.6% |
| Sudanese | 33.0 /100 | #187 | Fair 95.6% |
| Liberians | 32.4 /100 | #188 | Fair 95.6% |
| Immigrants | Micronesia | 31.6 /100 | #189 | Fair 95.6% |
| Immigrants | Venezuela | 30.8 /100 | #190 | Fair 95.6% |
| Immigrants | Nepal | 30.2 /100 | #191 | Fair 95.6% |
| Pima | 28.6 /100 | #192 | Fair 95.6% |
| Panamanians | 28.4 /100 | #193 | Fair 95.6% |