Uruguayan vs Spanish American Indian 8th Grade
COMPARE
Uruguayan
Spanish American Indian
8th Grade
8th Grade Comparison
Uruguayans
Spanish American Indians
95.1%
8TH GRADE
1.2/ 100
METRIC RATING
248th/ 347
METRIC RANK
89.8%
8TH GRADE
0.0/ 100
METRIC RATING
347th/ 347
METRIC RANK
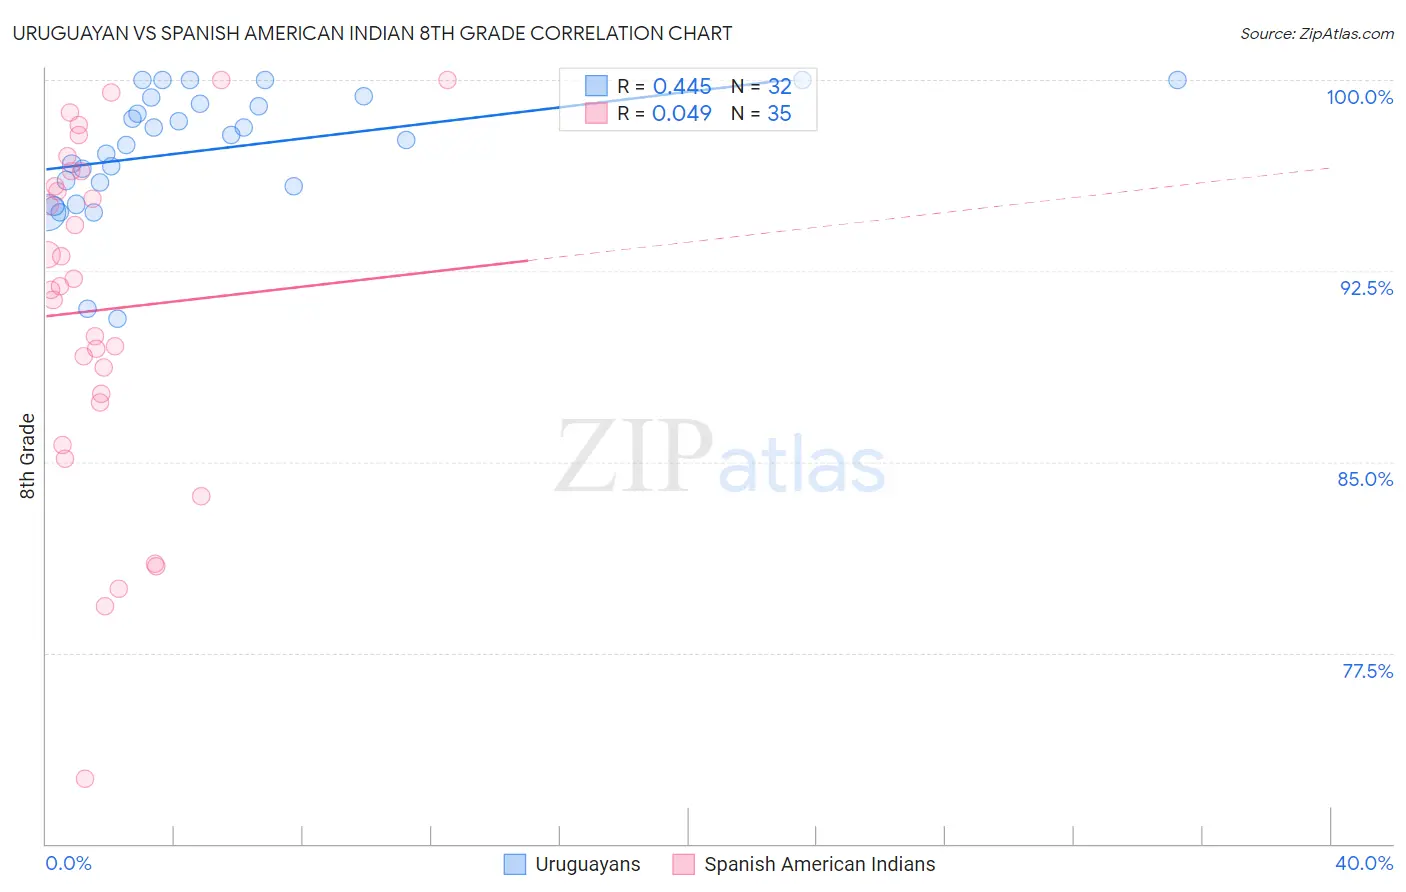
Uruguayan vs Spanish American Indian 8th Grade Correlation Chart
The statistical analysis conducted on geographies consisting of 144,782,794 people shows a moderate positive correlation between the proportion of Uruguayans and percentage of population with at least 8th grade education in the United States with a correlation coefficient (R) of 0.445 and weighted average of 95.1%. Similarly, the statistical analysis conducted on geographies consisting of 73,150,359 people shows no correlation between the proportion of Spanish American Indians and percentage of population with at least 8th grade education in the United States with a correlation coefficient (R) of 0.049 and weighted average of 89.8%, a difference of 5.9%.
8th Grade Correlation Summary
| Measurement | Uruguayan | Spanish American Indian |
| Minimum | 90.6% | 72.6% |
| Maximum | 100.0% | 100.0% |
| Range | 9.4% | 27.4% |
| Mean | 97.3% | 91.0% |
| Median | 97.7% | 91.9% |
| Interquartile 25% (IQ1) | 95.9% | 87.3% |
| Interquartile 75% (IQ3) | 99.2% | 96.4% |
| Interquartile Range (IQR) | 3.3% | 9.1% |
| Standard Deviation (Sample) | 2.4% | 6.7% |
| Standard Deviation (Population) | 2.4% | 6.6% |
Similar Demographics by 8th Grade
Demographics Similar to Uruguayans by 8th Grade
In terms of 8th grade, the demographic groups most similar to Uruguayans are Immigrants from Senegal (95.1%, a difference of 0.010%), Jamaican (95.1%, a difference of 0.020%), Somali (95.1%, a difference of 0.020%), Immigrants from China (95.0%, a difference of 0.020%), and Korean (95.0%, a difference of 0.020%).
| Demographics | Rating | Rank | 8th Grade |
| South American Indians | 1.9 /100 | #241 | Tragic 95.1% |
| Tongans | 1.7 /100 | #242 | Tragic 95.1% |
| Paiute | 1.7 /100 | #243 | Tragic 95.1% |
| Immigrants | Middle Africa | 1.7 /100 | #244 | Tragic 95.1% |
| Jamaicans | 1.4 /100 | #245 | Tragic 95.1% |
| Somalis | 1.4 /100 | #246 | Tragic 95.1% |
| Immigrants | Senegal | 1.4 /100 | #247 | Tragic 95.1% |
| Uruguayans | 1.2 /100 | #248 | Tragic 95.1% |
| Immigrants | China | 1.1 /100 | #249 | Tragic 95.0% |
| Koreans | 1.1 /100 | #250 | Tragic 95.0% |
| Bolivians | 1.0 /100 | #251 | Tragic 95.0% |
| Immigrants | Ethiopia | 1.0 /100 | #252 | Tragic 95.0% |
| U.S. Virgin Islanders | 0.9 /100 | #253 | Tragic 95.0% |
| Immigrants | Cameroon | 0.8 /100 | #254 | Tragic 95.0% |
| Immigrants | Somalia | 0.7 /100 | #255 | Tragic 95.0% |
Demographics Similar to Spanish American Indians by 8th Grade
In terms of 8th grade, the demographic groups most similar to Spanish American Indians are Immigrants from Mexico (90.2%, a difference of 0.44%), Immigrants from El Salvador (90.3%, a difference of 0.62%), Immigrants from Central America (90.4%, a difference of 0.71%), Immigrants from Guatemala (90.7%, a difference of 1.1%), and Salvadoran (90.9%, a difference of 1.3%).
| Demographics | Rating | Rank | 8th Grade |
| Hispanics or Latinos | 0.0 /100 | #333 | Tragic 92.2% |
| Immigrants | Yemen | 0.0 /100 | #334 | Tragic 92.1% |
| Mexican American Indians | 0.0 /100 | #335 | Tragic 92.1% |
| Immigrants | Honduras | 0.0 /100 | #336 | Tragic 91.9% |
| Immigrants | Latin America | 0.0 /100 | #337 | Tragic 91.7% |
| Central Americans | 0.0 /100 | #338 | Tragic 91.6% |
| Mexicans | 0.0 /100 | #339 | Tragic 91.4% |
| Yakama | 0.0 /100 | #340 | Tragic 91.2% |
| Guatemalans | 0.0 /100 | #341 | Tragic 91.1% |
| Salvadorans | 0.0 /100 | #342 | Tragic 90.9% |
| Immigrants | Guatemala | 0.0 /100 | #343 | Tragic 90.7% |
| Immigrants | Central America | 0.0 /100 | #344 | Tragic 90.4% |
| Immigrants | El Salvador | 0.0 /100 | #345 | Tragic 90.3% |
| Immigrants | Mexico | 0.0 /100 | #346 | Tragic 90.2% |
| Spanish American Indians | 0.0 /100 | #347 | Tragic 89.8% |