Nicaraguan vs Immigrants from Korea College, Under 1 year
COMPARE
Nicaraguan
Immigrants from Korea
College, Under 1 year
College, Under 1 year Comparison
Nicaraguans
Immigrants from Korea
59.2%
COLLEGE, UNDER 1 YEAR
0.0/ 100
METRIC RATING
292nd/ 347
METRIC RANK
71.6%
COLLEGE, UNDER 1 YEAR
100.0/ 100
METRIC RATING
20th/ 347
METRIC RANK
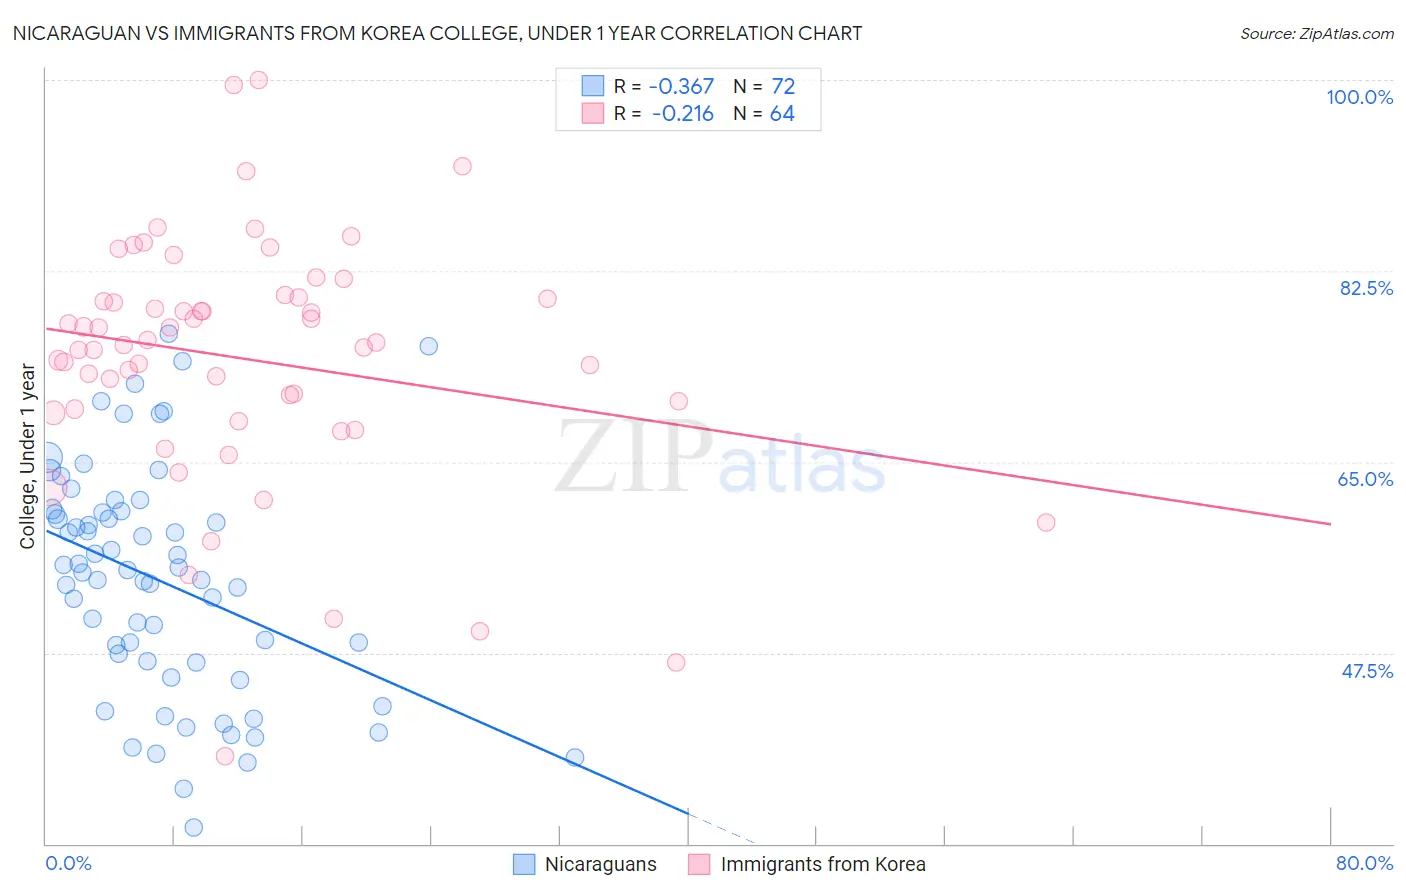
Nicaraguan vs Immigrants from Korea College, Under 1 year Correlation Chart
The statistical analysis conducted on geographies consisting of 285,711,556 people shows a mild negative correlation between the proportion of Nicaraguans and percentage of population with at least college, under 1 year education in the United States with a correlation coefficient (R) of -0.367 and weighted average of 59.2%. Similarly, the statistical analysis conducted on geographies consisting of 416,336,700 people shows a weak negative correlation between the proportion of Immigrants from Korea and percentage of population with at least college, under 1 year education in the United States with a correlation coefficient (R) of -0.216 and weighted average of 71.6%, a difference of 20.8%.
College, Under 1 year Correlation Summary
| Measurement | Nicaraguan | Immigrants from Korea |
| Minimum | 31.5% | 38.0% |
| Maximum | 76.7% | 100.0% |
| Range | 45.3% | 62.0% |
| Mean | 54.1% | 74.4% |
| Median | 55.0% | 75.8% |
| Interquartile 25% (IQ1) | 46.7% | 69.7% |
| Interquartile 75% (IQ3) | 60.4% | 80.0% |
| Interquartile Range (IQR) | 13.7% | 10.3% |
| Standard Deviation (Sample) | 10.4% | 11.4% |
| Standard Deviation (Population) | 10.4% | 11.3% |
Similar Demographics by College, Under 1 year
Demographics Similar to Nicaraguans by College, Under 1 year
In terms of college, under 1 year, the demographic groups most similar to Nicaraguans are Creek (59.3%, a difference of 0.040%), Ecuadorian (59.3%, a difference of 0.13%), Choctaw (59.3%, a difference of 0.17%), Seminole (59.1%, a difference of 0.18%), and Immigrants from Belize (59.1%, a difference of 0.20%).
| Demographics | Rating | Rank | College, Under 1 year |
| Paiute | 0.0 /100 | #285 | Tragic 59.6% |
| British West Indians | 0.0 /100 | #286 | Tragic 59.5% |
| Sioux | 0.0 /100 | #287 | Tragic 59.4% |
| Blacks/African Americans | 0.0 /100 | #288 | Tragic 59.4% |
| Choctaw | 0.0 /100 | #289 | Tragic 59.3% |
| Ecuadorians | 0.0 /100 | #290 | Tragic 59.3% |
| Creek | 0.0 /100 | #291 | Tragic 59.3% |
| Nicaraguans | 0.0 /100 | #292 | Tragic 59.2% |
| Seminole | 0.0 /100 | #293 | Tragic 59.1% |
| Immigrants | Belize | 0.0 /100 | #294 | Tragic 59.1% |
| Immigrants | Grenada | 0.0 /100 | #295 | Tragic 59.1% |
| Central American Indians | 0.0 /100 | #296 | Tragic 59.0% |
| Guyanese | 0.0 /100 | #297 | Tragic 59.0% |
| Immigrants | Ecuador | 0.0 /100 | #298 | Tragic 58.7% |
| Cubans | 0.0 /100 | #299 | Tragic 58.6% |
Demographics Similar to Immigrants from Korea by College, Under 1 year
In terms of college, under 1 year, the demographic groups most similar to Immigrants from Korea are Latvian (71.6%, a difference of 0.040%), Immigrants from Switzerland (71.7%, a difference of 0.15%), Immigrants from Belgium (71.5%, a difference of 0.15%), Eastern European (71.8%, a difference of 0.28%), and Immigrants from Eastern Asia (71.3%, a difference of 0.40%).
| Demographics | Rating | Rank | College, Under 1 year |
| Cypriots | 100.0 /100 | #13 | Exceptional 72.0% |
| Cambodians | 100.0 /100 | #14 | Exceptional 71.9% |
| Burmese | 100.0 /100 | #15 | Exceptional 71.9% |
| Immigrants | Japan | 100.0 /100 | #16 | Exceptional 71.9% |
| Eastern Europeans | 100.0 /100 | #17 | Exceptional 71.8% |
| Immigrants | Switzerland | 100.0 /100 | #18 | Exceptional 71.7% |
| Latvians | 100.0 /100 | #19 | Exceptional 71.6% |
| Immigrants | Korea | 100.0 /100 | #20 | Exceptional 71.6% |
| Immigrants | Belgium | 100.0 /100 | #21 | Exceptional 71.5% |
| Immigrants | Eastern Asia | 100.0 /100 | #22 | Exceptional 71.3% |
| Immigrants | Northern Europe | 100.0 /100 | #23 | Exceptional 71.1% |
| Soviet Union | 100.0 /100 | #24 | Exceptional 71.1% |
| Bulgarians | 100.0 /100 | #25 | Exceptional 71.1% |
| Immigrants | Denmark | 100.0 /100 | #26 | Exceptional 71.0% |
| Immigrants | Ireland | 100.0 /100 | #27 | Exceptional 71.0% |