Ugandan vs Immigrants from Honduras Unemployment Among Women with Children Under 18 years
COMPARE
Ugandan
Immigrants from Honduras
Unemployment Among Women with Children Under 18 years
Unemployment Among Women with Children Under 18 years Comparison
Ugandans
Immigrants from Honduras
5.9%
UNEMPLOYMENT AMONG WOMEN WITH CHILDREN UNDER 18 YEARS
1.1/ 100
METRIC RATING
245th/ 347
METRIC RANK
6.5%
UNEMPLOYMENT AMONG WOMEN WITH CHILDREN UNDER 18 YEARS
0.0/ 100
METRIC RATING
303rd/ 347
METRIC RANK
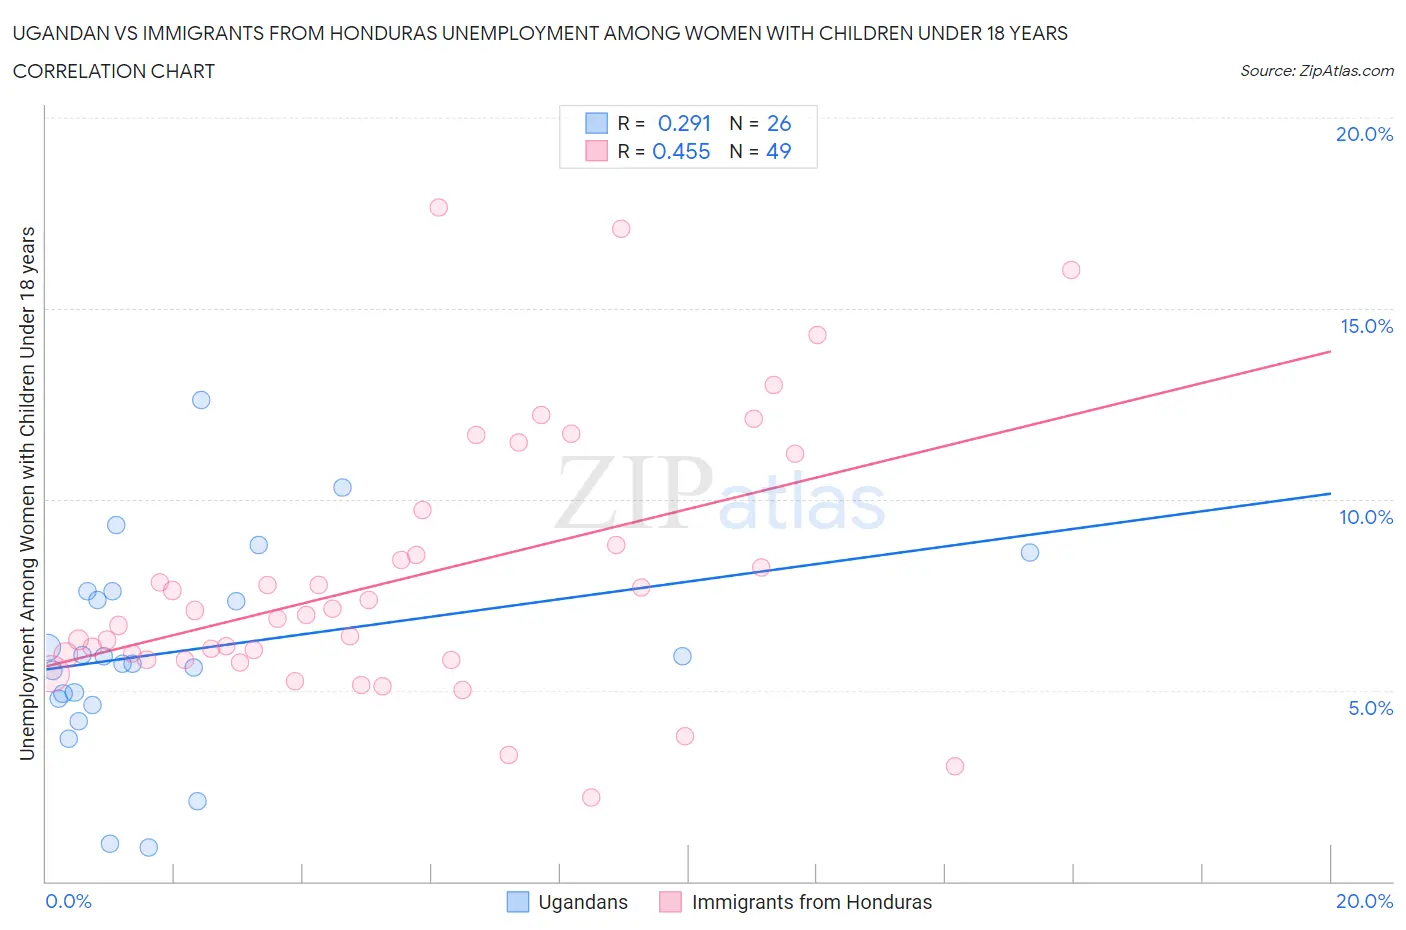
Ugandan vs Immigrants from Honduras Unemployment Among Women with Children Under 18 years Correlation Chart
The statistical analysis conducted on geographies consisting of 93,232,575 people shows a weak positive correlation between the proportion of Ugandans and unemployment rate among women with children under the age of 18 in the United States with a correlation coefficient (R) of 0.291 and weighted average of 5.9%. Similarly, the statistical analysis conducted on geographies consisting of 314,466,828 people shows a moderate positive correlation between the proportion of Immigrants from Honduras and unemployment rate among women with children under the age of 18 in the United States with a correlation coefficient (R) of 0.455 and weighted average of 6.5%, a difference of 10.0%.
Unemployment Among Women with Children Under 18 years Correlation Summary
| Measurement | Ugandan | Immigrants from Honduras |
| Minimum | 0.90% | 2.2% |
| Maximum | 12.6% | 17.6% |
| Range | 11.7% | 15.4% |
| Mean | 6.0% | 7.9% |
| Median | 5.8% | 7.0% |
| Interquartile 25% (IQ1) | 4.8% | 5.8% |
| Interquartile 75% (IQ3) | 7.6% | 9.3% |
| Interquartile Range (IQR) | 2.8% | 3.5% |
| Standard Deviation (Sample) | 2.7% | 3.5% |
| Standard Deviation (Population) | 2.6% | 3.5% |
Similar Demographics by Unemployment Among Women with Children Under 18 years
Demographics Similar to Ugandans by Unemployment Among Women with Children Under 18 years
In terms of unemployment among women with children under 18 years, the demographic groups most similar to Ugandans are Choctaw (5.9%, a difference of 0.040%), Immigrants from Uruguay (5.9%, a difference of 0.090%), Uruguayan (5.9%, a difference of 0.13%), Cape Verdean (5.9%, a difference of 0.21%), and Moroccan (5.9%, a difference of 0.38%).
| Demographics | Rating | Rank | Unemployment Among Women with Children Under 18 years |
| Immigrants | Somalia | 2.2 /100 | #238 | Tragic 5.8% |
| Immigrants | Sierra Leone | 2.0 /100 | #239 | Tragic 5.8% |
| Immigrants | Immigrants | 2.0 /100 | #240 | Tragic 5.8% |
| Brazilians | 1.6 /100 | #241 | Tragic 5.8% |
| Moroccans | 1.4 /100 | #242 | Tragic 5.9% |
| Immigrants | Uruguay | 1.1 /100 | #243 | Tragic 5.9% |
| Choctaw | 1.1 /100 | #244 | Tragic 5.9% |
| Ugandans | 1.1 /100 | #245 | Tragic 5.9% |
| Uruguayans | 1.0 /100 | #246 | Tragic 5.9% |
| Cape Verdeans | 1.0 /100 | #247 | Tragic 5.9% |
| Delaware | 0.8 /100 | #248 | Tragic 5.9% |
| Immigrants | Cameroon | 0.8 /100 | #249 | Tragic 5.9% |
| Immigrants | Cabo Verde | 0.7 /100 | #250 | Tragic 5.9% |
| Ute | 0.7 /100 | #251 | Tragic 5.9% |
| Seminole | 0.5 /100 | #252 | Tragic 6.0% |
Demographics Similar to Immigrants from Honduras by Unemployment Among Women with Children Under 18 years
In terms of unemployment among women with children under 18 years, the demographic groups most similar to Immigrants from Honduras are Vietnamese (6.5%, a difference of 0.0%), Immigrants from Armenia (6.5%, a difference of 0.23%), Immigrants from Haiti (6.4%, a difference of 0.49%), Immigrants from Jamaica (6.4%, a difference of 0.54%), and Jamaican (6.4%, a difference of 0.67%).
| Demographics | Rating | Rank | Unemployment Among Women with Children Under 18 years |
| Haitians | 0.0 /100 | #296 | Tragic 6.4% |
| Immigrants | Senegal | 0.0 /100 | #297 | Tragic 6.4% |
| Immigrants | Latin America | 0.0 /100 | #298 | Tragic 6.4% |
| Jamaicans | 0.0 /100 | #299 | Tragic 6.4% |
| Immigrants | Jamaica | 0.0 /100 | #300 | Tragic 6.4% |
| Immigrants | Haiti | 0.0 /100 | #301 | Tragic 6.4% |
| Immigrants | Armenia | 0.0 /100 | #302 | Tragic 6.5% |
| Immigrants | Honduras | 0.0 /100 | #303 | Tragic 6.5% |
| Vietnamese | 0.0 /100 | #304 | Tragic 6.5% |
| Immigrants | Central America | 0.0 /100 | #305 | Tragic 6.5% |
| Immigrants | Guyana | 0.0 /100 | #306 | Tragic 6.5% |
| Belizeans | 0.0 /100 | #307 | Tragic 6.5% |
| Africans | 0.0 /100 | #308 | Tragic 6.5% |
| Ecuadorians | 0.0 /100 | #309 | Tragic 6.5% |
| Guyanese | 0.0 /100 | #310 | Tragic 6.6% |