Turkish vs Zimbabwean 2nd Grade
COMPARE
Turkish
Zimbabwean
2nd Grade
2nd Grade Comparison
Turks
Zimbabweans
98.2%
2ND GRADE
97.6/ 100
METRIC RATING
104th/ 347
METRIC RANK
98.2%
2ND GRADE
98.8/ 100
METRIC RATING
90th/ 347
METRIC RANK
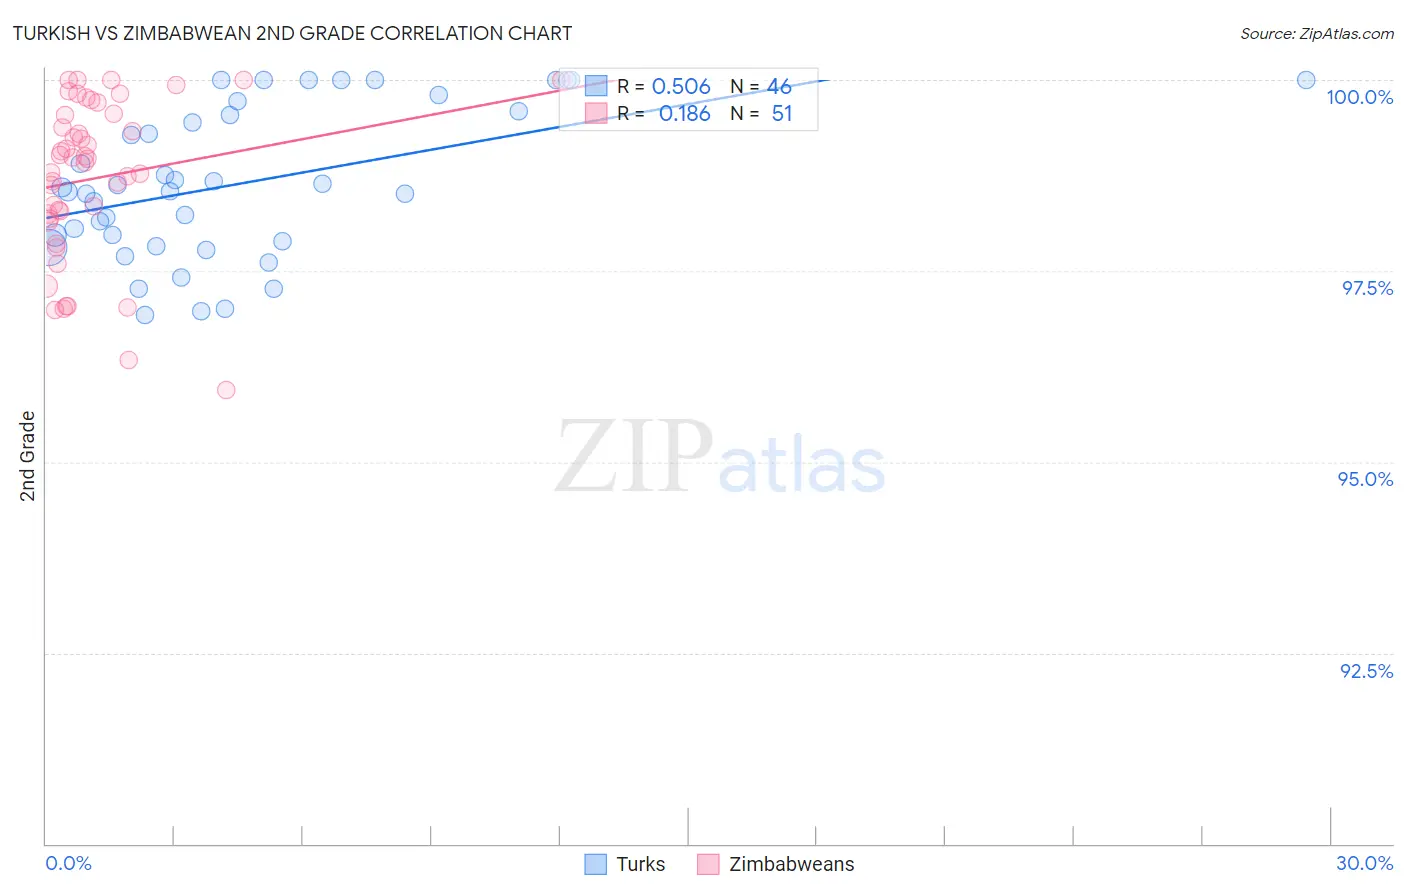
Turkish vs Zimbabwean 2nd Grade Correlation Chart
The statistical analysis conducted on geographies consisting of 271,858,657 people shows a substantial positive correlation between the proportion of Turks and percentage of population with at least 2nd grade education in the United States with a correlation coefficient (R) of 0.506 and weighted average of 98.2%. Similarly, the statistical analysis conducted on geographies consisting of 69,203,423 people shows a poor positive correlation between the proportion of Zimbabweans and percentage of population with at least 2nd grade education in the United States with a correlation coefficient (R) of 0.186 and weighted average of 98.2%, a difference of 0.060%.
2nd Grade Correlation Summary
| Measurement | Turkish | Zimbabwean |
| Minimum | 96.9% | 95.9% |
| Maximum | 100.0% | 100.0% |
| Range | 3.1% | 4.1% |
| Mean | 98.7% | 98.7% |
| Median | 98.6% | 99.0% |
| Interquartile 25% (IQ1) | 97.9% | 98.2% |
| Interquartile 75% (IQ3) | 99.6% | 99.6% |
| Interquartile Range (IQR) | 1.7% | 1.4% |
| Standard Deviation (Sample) | 0.97% | 1.0% |
| Standard Deviation (Population) | 0.96% | 1.0% |
Demographics Similar to Turks and Zimbabweans by 2nd Grade
In terms of 2nd grade, the demographic groups most similar to Turks are Pima (98.2%, a difference of 0.0%), Yugoslavian (98.2%, a difference of 0.0%), Bhutanese (98.1%, a difference of 0.0%), German Russian (98.1%, a difference of 0.0%), and Immigrants from Ireland (98.2%, a difference of 0.020%). Similarly, the demographic groups most similar to Zimbabweans are Immigrants from Western Europe (98.2%, a difference of 0.0%), Immigrants from South Africa (98.2%, a difference of 0.0%), Immigrants from India (98.2%, a difference of 0.0%), Immigrants from Denmark (98.2%, a difference of 0.010%), and Macedonian (98.2%, a difference of 0.010%).
| Demographics | Rating | Rank | 2nd Grade |
| Immigrants | Denmark | 99.0 /100 | #87 | Exceptional 98.2% |
| Macedonians | 99.0 /100 | #88 | Exceptional 98.2% |
| Ukrainians | 98.9 /100 | #89 | Exceptional 98.2% |
| Zimbabweans | 98.8 /100 | #90 | Exceptional 98.2% |
| Immigrants | Western Europe | 98.8 /100 | #91 | Exceptional 98.2% |
| Immigrants | South Africa | 98.8 /100 | #92 | Exceptional 98.2% |
| Immigrants | India | 98.8 /100 | #93 | Exceptional 98.2% |
| Immigrants | Germany | 98.6 /100 | #94 | Exceptional 98.2% |
| South Africans | 98.6 /100 | #95 | Exceptional 98.2% |
| Cypriots | 98.4 /100 | #96 | Exceptional 98.2% |
| Choctaw | 98.3 /100 | #97 | Exceptional 98.2% |
| Immigrants | Nonimmigrants | 98.3 /100 | #98 | Exceptional 98.2% |
| Immigrants | Ireland | 98.0 /100 | #99 | Exceptional 98.2% |
| Romanians | 98.0 /100 | #100 | Exceptional 98.2% |
| Puget Sound Salish | 98.0 /100 | #101 | Exceptional 98.2% |
| Cree | 98.0 /100 | #102 | Exceptional 98.2% |
| Pima | 97.6 /100 | #103 | Exceptional 98.2% |
| Turks | 97.6 /100 | #104 | Exceptional 98.2% |
| Yugoslavians | 97.5 /100 | #105 | Exceptional 98.2% |
| Bhutanese | 97.5 /100 | #106 | Exceptional 98.1% |
| German Russians | 97.4 /100 | #107 | Exceptional 98.1% |