Immigrants from Western Africa vs Zimbabwean 2nd Grade
COMPARE
Immigrants from Western Africa
Zimbabwean
2nd Grade
2nd Grade Comparison
Immigrants from Western Africa
Zimbabweans
97.3%
2ND GRADE
0.1/ 100
METRIC RATING
277th/ 347
METRIC RANK
98.2%
2ND GRADE
98.8/ 100
METRIC RATING
90th/ 347
METRIC RANK
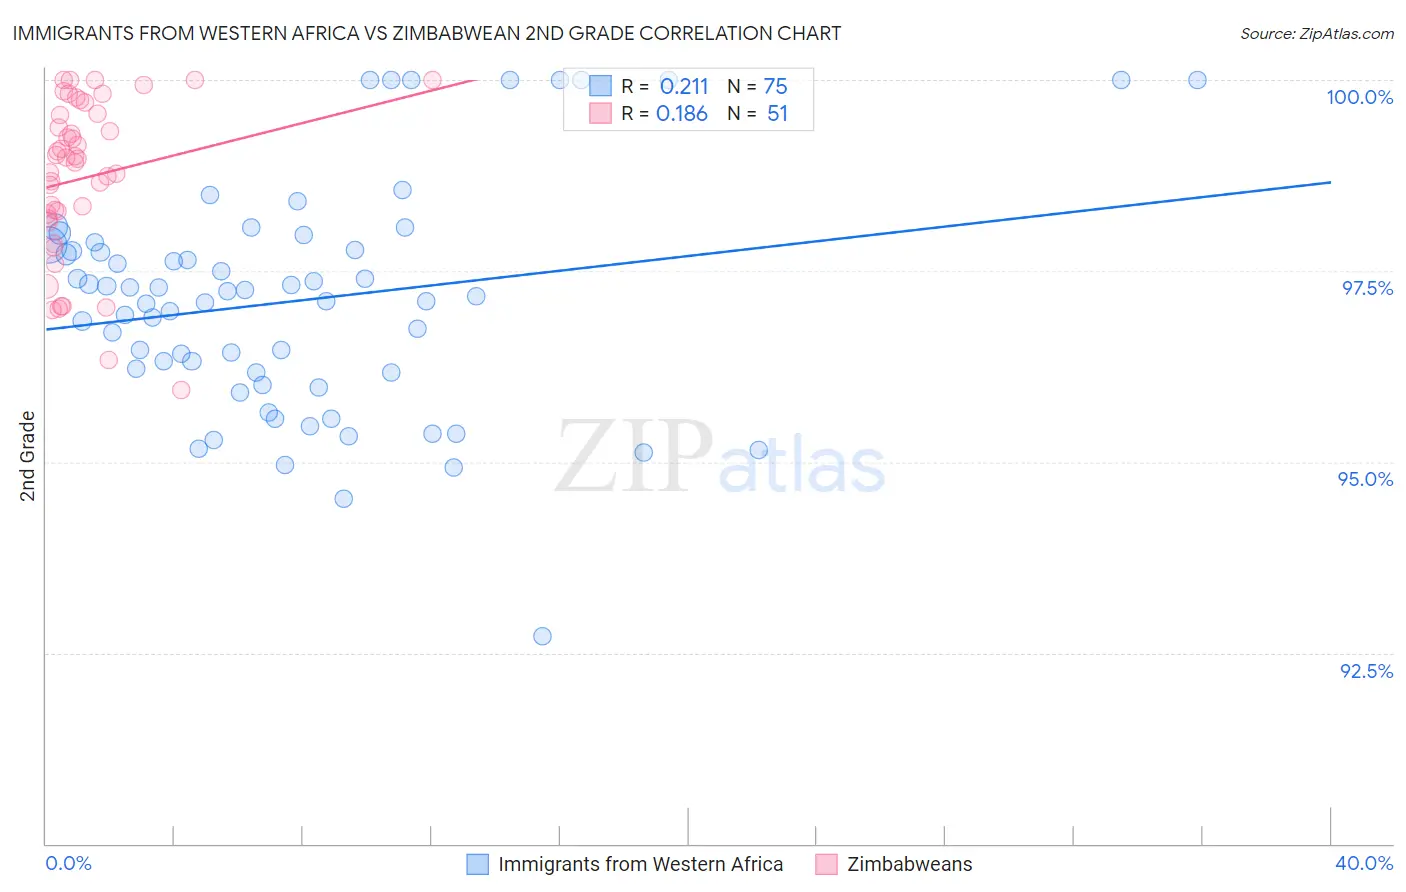
Immigrants from Western Africa vs Zimbabwean 2nd Grade Correlation Chart
The statistical analysis conducted on geographies consisting of 357,811,354 people shows a weak positive correlation between the proportion of Immigrants from Western Africa and percentage of population with at least 2nd grade education in the United States with a correlation coefficient (R) of 0.211 and weighted average of 97.3%. Similarly, the statistical analysis conducted on geographies consisting of 69,203,423 people shows a poor positive correlation between the proportion of Zimbabweans and percentage of population with at least 2nd grade education in the United States with a correlation coefficient (R) of 0.186 and weighted average of 98.2%, a difference of 0.92%.
2nd Grade Correlation Summary
| Measurement | Immigrants from Western Africa | Zimbabwean |
| Minimum | 92.7% | 95.9% |
| Maximum | 100.0% | 100.0% |
| Range | 7.3% | 4.1% |
| Mean | 97.1% | 98.7% |
| Median | 97.2% | 99.0% |
| Interquartile 25% (IQ1) | 96.2% | 98.2% |
| Interquartile 75% (IQ3) | 97.8% | 99.6% |
| Interquartile Range (IQR) | 1.7% | 1.4% |
| Standard Deviation (Sample) | 1.5% | 1.0% |
| Standard Deviation (Population) | 1.5% | 1.0% |
Similar Demographics by 2nd Grade
Demographics Similar to Immigrants from Western Africa by 2nd Grade
In terms of 2nd grade, the demographic groups most similar to Immigrants from Western Africa are Immigrants from Philippines (97.3%, a difference of 0.0%), Immigrants from Uzbekistan (97.3%, a difference of 0.010%), Immigrants from Ghana (97.3%, a difference of 0.020%), Afghan (97.3%, a difference of 0.020%), and Immigrants from China (97.3%, a difference of 0.030%).
| Demographics | Rating | Rank | 2nd Grade |
| Immigrants | Jamaica | 0.2 /100 | #270 | Tragic 97.4% |
| Immigrants | Cameroon | 0.2 /100 | #271 | Tragic 97.4% |
| Immigrants | Peru | 0.1 /100 | #272 | Tragic 97.4% |
| Immigrants | Bolivia | 0.1 /100 | #273 | Tragic 97.4% |
| Ghanaians | 0.1 /100 | #274 | Tragic 97.4% |
| Immigrants | China | 0.1 /100 | #275 | Tragic 97.3% |
| Immigrants | Philippines | 0.1 /100 | #276 | Tragic 97.3% |
| Immigrants | Western Africa | 0.1 /100 | #277 | Tragic 97.3% |
| Immigrants | Uzbekistan | 0.1 /100 | #278 | Tragic 97.3% |
| Immigrants | Ghana | 0.1 /100 | #279 | Tragic 97.3% |
| Afghans | 0.1 /100 | #280 | Tragic 97.3% |
| Trinidadians and Tobagonians | 0.1 /100 | #281 | Tragic 97.3% |
| Barbadians | 0.1 /100 | #282 | Tragic 97.3% |
| Immigrants | Trinidad and Tobago | 0.0 /100 | #283 | Tragic 97.2% |
| Immigrants | West Indies | 0.0 /100 | #284 | Tragic 97.2% |
Demographics Similar to Zimbabweans by 2nd Grade
In terms of 2nd grade, the demographic groups most similar to Zimbabweans are Immigrants from Western Europe (98.2%, a difference of 0.0%), Immigrants from South Africa (98.2%, a difference of 0.0%), Immigrants from India (98.2%, a difference of 0.0%), Immigrants from Australia (98.2%, a difference of 0.010%), and Immigrants from Denmark (98.2%, a difference of 0.010%).
| Demographics | Rating | Rank | 2nd Grade |
| Immigrants | Sweden | 99.1 /100 | #83 | Exceptional 98.2% |
| Hopi | 99.1 /100 | #84 | Exceptional 98.2% |
| Potawatomi | 99.1 /100 | #85 | Exceptional 98.2% |
| Immigrants | Australia | 99.0 /100 | #86 | Exceptional 98.2% |
| Immigrants | Denmark | 99.0 /100 | #87 | Exceptional 98.2% |
| Macedonians | 99.0 /100 | #88 | Exceptional 98.2% |
| Ukrainians | 98.9 /100 | #89 | Exceptional 98.2% |
| Zimbabweans | 98.8 /100 | #90 | Exceptional 98.2% |
| Immigrants | Western Europe | 98.8 /100 | #91 | Exceptional 98.2% |
| Immigrants | South Africa | 98.8 /100 | #92 | Exceptional 98.2% |
| Immigrants | India | 98.8 /100 | #93 | Exceptional 98.2% |
| Immigrants | Germany | 98.6 /100 | #94 | Exceptional 98.2% |
| South Africans | 98.6 /100 | #95 | Exceptional 98.2% |
| Cypriots | 98.4 /100 | #96 | Exceptional 98.2% |
| Choctaw | 98.3 /100 | #97 | Exceptional 98.2% |