Turkish vs Immigrants from Netherlands 2nd Grade
COMPARE
Turkish
Immigrants from Netherlands
2nd Grade
2nd Grade Comparison
Turks
Immigrants from Netherlands
98.2%
2ND GRADE
97.6/ 100
METRIC RATING
104th/ 347
METRIC RANK
98.3%
2ND GRADE
99.4/ 100
METRIC RATING
74th/ 347
METRIC RANK
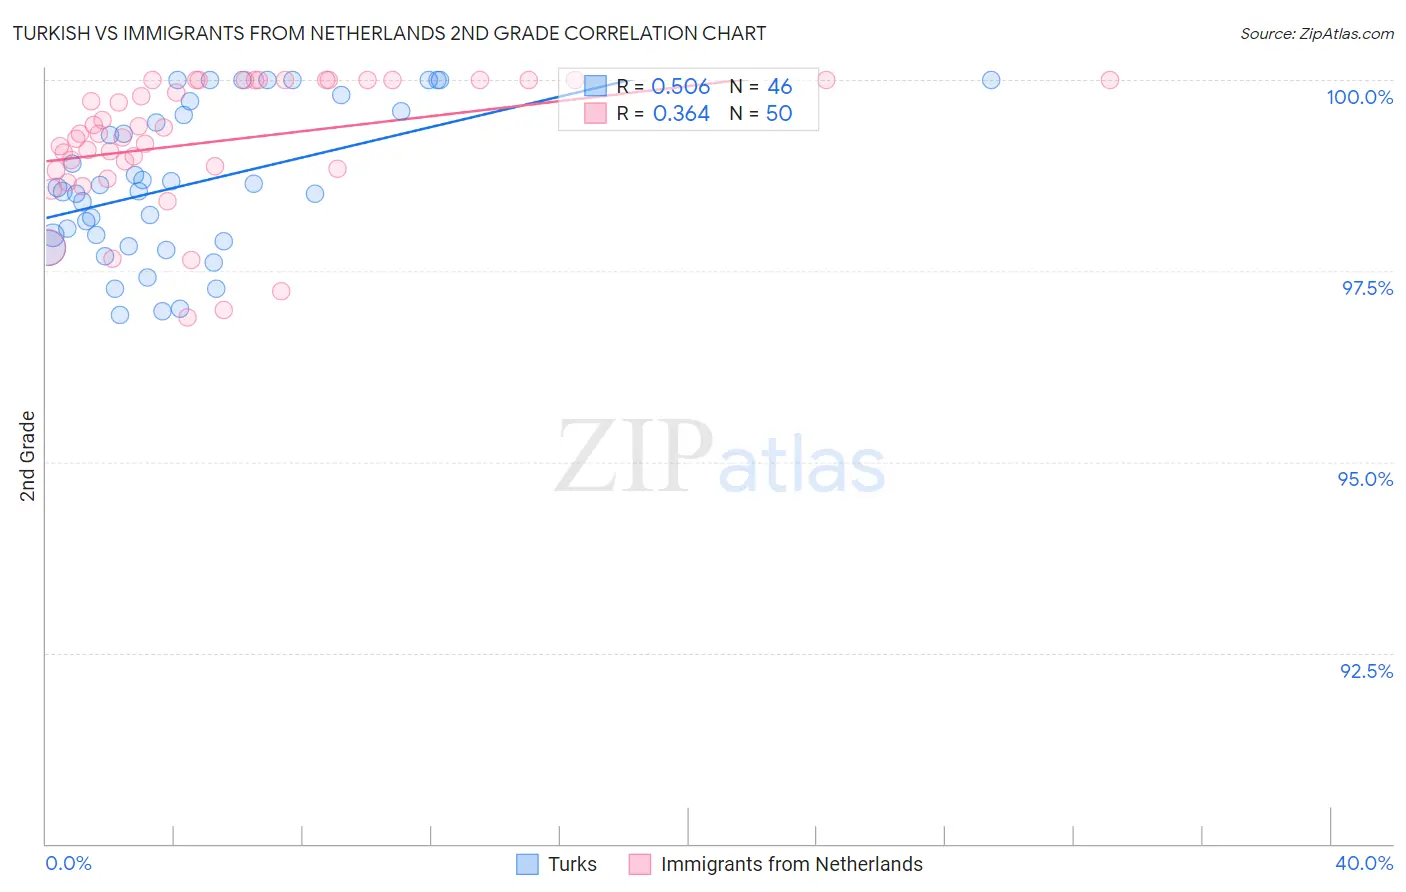
Turkish vs Immigrants from Netherlands 2nd Grade Correlation Chart
The statistical analysis conducted on geographies consisting of 271,858,657 people shows a substantial positive correlation between the proportion of Turks and percentage of population with at least 2nd grade education in the United States with a correlation coefficient (R) of 0.506 and weighted average of 98.2%. Similarly, the statistical analysis conducted on geographies consisting of 237,869,934 people shows a mild positive correlation between the proportion of Immigrants from Netherlands and percentage of population with at least 2nd grade education in the United States with a correlation coefficient (R) of 0.364 and weighted average of 98.3%, a difference of 0.11%.
2nd Grade Correlation Summary
| Measurement | Turkish | Immigrants from Netherlands |
| Minimum | 96.9% | 96.9% |
| Maximum | 100.0% | 100.0% |
| Range | 3.1% | 3.1% |
| Mean | 98.7% | 99.2% |
| Median | 98.6% | 99.3% |
| Interquartile 25% (IQ1) | 97.9% | 98.8% |
| Interquartile 75% (IQ3) | 99.6% | 100.0% |
| Interquartile Range (IQR) | 1.7% | 1.2% |
| Standard Deviation (Sample) | 0.97% | 0.85% |
| Standard Deviation (Population) | 0.96% | 0.84% |
Similar Demographics by 2nd Grade
Demographics Similar to Turks by 2nd Grade
In terms of 2nd grade, the demographic groups most similar to Turks are Pima (98.2%, a difference of 0.0%), Yugoslavian (98.2%, a difference of 0.0%), Bhutanese (98.1%, a difference of 0.0%), German Russian (98.1%, a difference of 0.0%), and Immigrants from Switzerland (98.1%, a difference of 0.010%).
| Demographics | Rating | Rank | 2nd Grade |
| Choctaw | 98.3 /100 | #97 | Exceptional 98.2% |
| Immigrants | Nonimmigrants | 98.3 /100 | #98 | Exceptional 98.2% |
| Immigrants | Ireland | 98.0 /100 | #99 | Exceptional 98.2% |
| Romanians | 98.0 /100 | #100 | Exceptional 98.2% |
| Puget Sound Salish | 98.0 /100 | #101 | Exceptional 98.2% |
| Cree | 98.0 /100 | #102 | Exceptional 98.2% |
| Pima | 97.6 /100 | #103 | Exceptional 98.2% |
| Turks | 97.6 /100 | #104 | Exceptional 98.2% |
| Yugoslavians | 97.5 /100 | #105 | Exceptional 98.2% |
| Bhutanese | 97.5 /100 | #106 | Exceptional 98.1% |
| German Russians | 97.4 /100 | #107 | Exceptional 98.1% |
| Immigrants | Switzerland | 97.3 /100 | #108 | Exceptional 98.1% |
| Basques | 97.2 /100 | #109 | Exceptional 98.1% |
| Immigrants | Singapore | 97.0 /100 | #110 | Exceptional 98.1% |
| Immigrants | Czechoslovakia | 96.9 /100 | #111 | Exceptional 98.1% |
Demographics Similar to Immigrants from Netherlands by 2nd Grade
In terms of 2nd grade, the demographic groups most similar to Immigrants from Netherlands are Shoshone (98.3%, a difference of 0.010%), Cherokee (98.3%, a difference of 0.010%), Immigrants from England (98.3%, a difference of 0.010%), Cheyenne (98.3%, a difference of 0.020%), and Cajun (98.3%, a difference of 0.020%).
| Demographics | Rating | Rank | 2nd Grade |
| Immigrants | Northern Europe | 99.7 /100 | #67 | Exceptional 98.3% |
| Russians | 99.7 /100 | #68 | Exceptional 98.3% |
| Immigrants | Austria | 99.6 /100 | #69 | Exceptional 98.3% |
| Serbians | 99.6 /100 | #70 | Exceptional 98.3% |
| Chickasaw | 99.6 /100 | #71 | Exceptional 98.3% |
| Cheyenne | 99.6 /100 | #72 | Exceptional 98.3% |
| Cajuns | 99.5 /100 | #73 | Exceptional 98.3% |
| Immigrants | Netherlands | 99.4 /100 | #74 | Exceptional 98.3% |
| Shoshone | 99.4 /100 | #75 | Exceptional 98.3% |
| Cherokee | 99.4 /100 | #76 | Exceptional 98.3% |
| Immigrants | England | 99.4 /100 | #77 | Exceptional 98.3% |
| Immigrants | Lithuania | 99.3 /100 | #78 | Exceptional 98.2% |
| Immigrants | Belgium | 99.3 /100 | #79 | Exceptional 98.2% |
| Osage | 99.2 /100 | #80 | Exceptional 98.2% |
| Icelanders | 99.2 /100 | #81 | Exceptional 98.2% |